INVITE-ONLY SCRIPT
Idnistrade24 MegaOscillator Indicator
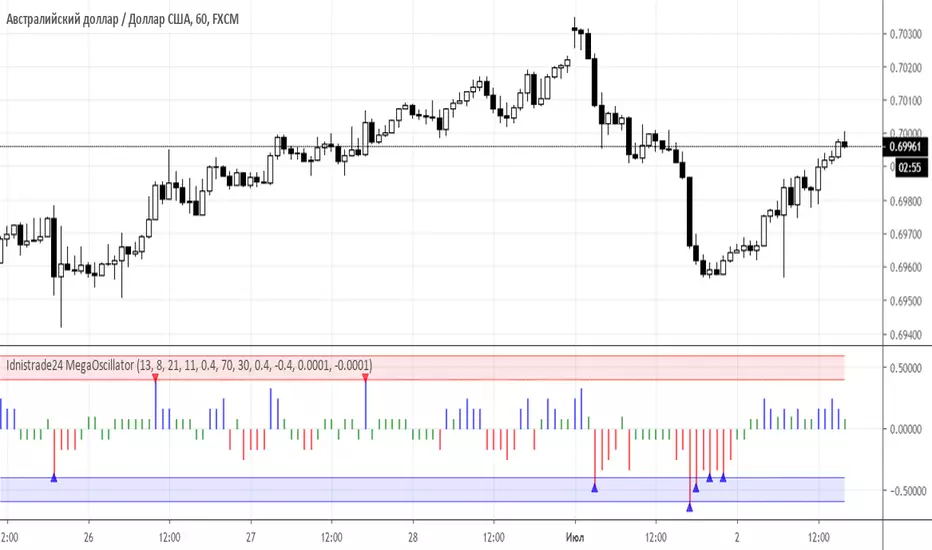
“Idnistrade24 MegaOscillator” Indicator

Class: oscillator
Trading type: any
Time frame: any
Purpose: detection of trend reversal points
Level of aggressiveness: any
"Idnistrade24 MegaOscillator" indicator is designed to detect the trend reversal points. The class of technical indicators, which is responsible for determining the reversal points of the current trend, are oscillators. At the moment there are hundreds of different variations of oscillators. The idea that formed the basis for creating the “Idnistrade24 MegaOscillator” is to obtain a synergistic effect from the use of the best oscillator techniques.
“Idnistrade24 MegaOscillator” indicator is a symbiosis of such techniques as autoregression analysis, range trading, RSI, ROC, MACD, which results in obtaining the integral value of the current overbought/oversold level in the market.
Based on the overbought/oversold level in the market, “Idnistrade24 MegaOscillator” indicator independently generates buy / sell signals and displays them in the indicator window.
Structure of the indicator
Indicator consists of the following elements:
- the mega-oscillator histogram – is presented in three colors: blue (the market is overbought), red (the market is oversold) and green (there are no serious deviations from the fair price);
- red zone – indication of an extreme overbought zone. Entry into this zone is a signal to close long positions and search for points to sell asset;
- blue zone - indication of an extreme oversold zone. Entry into this zone is a signal for closing short positions and search points to buy asset.
Parameters of the indicator
To configure the indicator, the following parameters are provided:
- periodRSI (default value is 13) - period for calculating the RSI oscillator.
- periodROC (default value - 8) - period for calculating the ROC oscillator.
- periodRanger (default value - 21) - period for calculating the range in range trading.
- periodReg (default value - 11) - period for the calculation of autoregression.
- signals (default is 0.4) - the parameter used to control the frequency of signals. The lower it is, the more signals the indicator will generate.
- overboughtRSI (the default value is 70) - the parameter defining the overbought zone for the RSI indicator.
- overboughtRSI (the default value is 30) - the parameter that determines the border of the oversold zone for the RSI indicator.
- overboughtROC (the default value is 0.4) - the parameter defining the overbought zone for the ROC indicator.
- overboughtROC (the default value is -0.4) —the parameter that determines the oversold zone for the ROC indicator.
- overboughtMACD (default value - 0.0001) - the parameter that determines the overbought zone for the MACD indicator.
- overboughtMACD (the default value is -0.0001) is the parameter that determines the oversold zone for the MACD indicator.
Rules of trading
The main task of the trader when working with this indicator is to monitor the color of the histogram and its position relative to the extreme zones. Entering the red zone is a signal for closing long positions and finding points for selling assets. Entering the blue zone is a signal for closing short positions and finding points for asset purchases.
The appearance of a blue triangle on the histogram is a buy aignal, and a red triangle is a sell signal.
Авторские индикаторы
bit.ly/2oBvkHY
Больше информации на нашем ютьюб-канале
youtube.com/channel/UCYEOurJfasXWyYnrriGwsqQ
bit.ly/2oBvkHY
Больше информации на нашем ютьюб-канале
youtube.com/channel/UCYEOurJfasXWyYnrriGwsqQ
免責聲明
這些資訊和出版物並非旨在提供,也不構成TradingView提供或認可的任何形式的財務、投資、交易或其他類型的建議或推薦。請閱讀使用條款以了解更多資訊。