OPEN-SOURCE SCRIPT
已更新 Volume Candlestick Heatmap Colors [vnhilton]
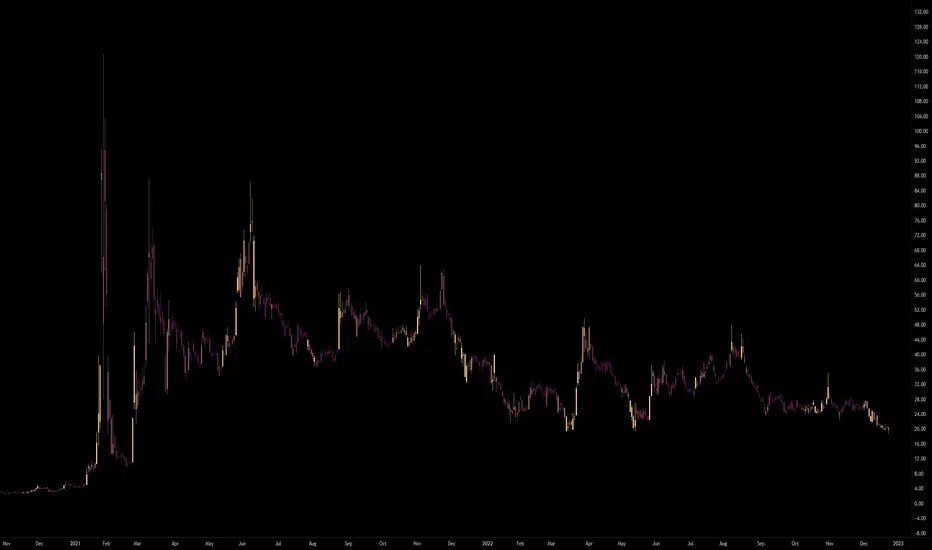
This indicator colours candles based on their volume for a set period of time. The highest volume & lowest volume in this period are set by 2 colours, & any candle with volume inside the range will have a colour based on the gradient created by the 2 colours. Ability to hide the candle body, wick, border if preferred (Hide candlestick body, wick, border, through the settings if applicable). Features 20 pre-set themes + ability to set your own custom theme.

Anamnisar; Aubergine; Between The Clouds; Bichrome

Bora Bora; Candy; Cherryblossoms; Dracula

Dance To Forget; Fresh Turboscent; Friday; Frozen

Miaka; Minnesota Vikings; Misty Meadow; Monochrome

Neon Life; Purple Bliss; Purple Paradise; Sea Blizz

Shore; Sky; Starfall; Superman

Talking To Mice Elf; The Strain; Winter; Vasily
Anamnisar; Aubergine; Between The Clouds; Bichrome
Bora Bora; Candy; Cherryblossoms; Dracula
Dance To Forget; Fresh Turboscent; Friday; Frozen
Miaka; Minnesota Vikings; Misty Meadow; Monochrome
Neon Life; Purple Bliss; Purple Paradise; Sea Blizz
Shore; Sky; Starfall; Superman
Talking To Mice Elf; The Strain; Winter; Vasily
發行說明
CORRECTION: 28* themes not 20.發行說明
- Added new price types: Bar, line (which also includes step line, step line w/ diamonds, histogram, cross, area, area with breaks, columns, circles)From left to right: bar; candlestick; line
發行說明
- Added separate theme colors for ETH pricesETH prices in monochrome theme; RTH prices in custom "dracula" theme.
發行說明
- Added volume circles that appear when the volume is the maximum out of the selected period by the user. These circles are adjustable in size and have separate colors for ETH and RTH.Maximum volume circles for RTH and ETH. Notice how volume comes in around technical analysis setups.
開源腳本
本著TradingView的真正精神,此腳本的創建者將其開源,以便交易者可以查看和驗證其功能。向作者致敬!雖然您可以免費使用它,但請記住,重新發佈程式碼必須遵守我們的網站規則。
免責聲明
這些資訊和出版物並不意味著也不構成TradingView提供或認可的金融、投資、交易或其他類型的意見或建議。請在使用條款閱讀更多資訊。
開源腳本
本著TradingView的真正精神,此腳本的創建者將其開源,以便交易者可以查看和驗證其功能。向作者致敬!雖然您可以免費使用它,但請記住,重新發佈程式碼必須遵守我們的網站規則。
免責聲明
這些資訊和出版物並不意味著也不構成TradingView提供或認可的金融、投資、交易或其他類型的意見或建議。請在使用條款閱讀更多資訊。