INVITE-ONLY SCRIPT
Unusual Market Volume Detector
Introduction
Price usually moves in lockstep with the volume trends i.e. price goes higher when there is buying and it goes down when there is selling in the market. But sometimes, the market behaves unusually i.e. Price and volume move in opposite directions. This indicator identifies precisely this divergent behavior in the market!
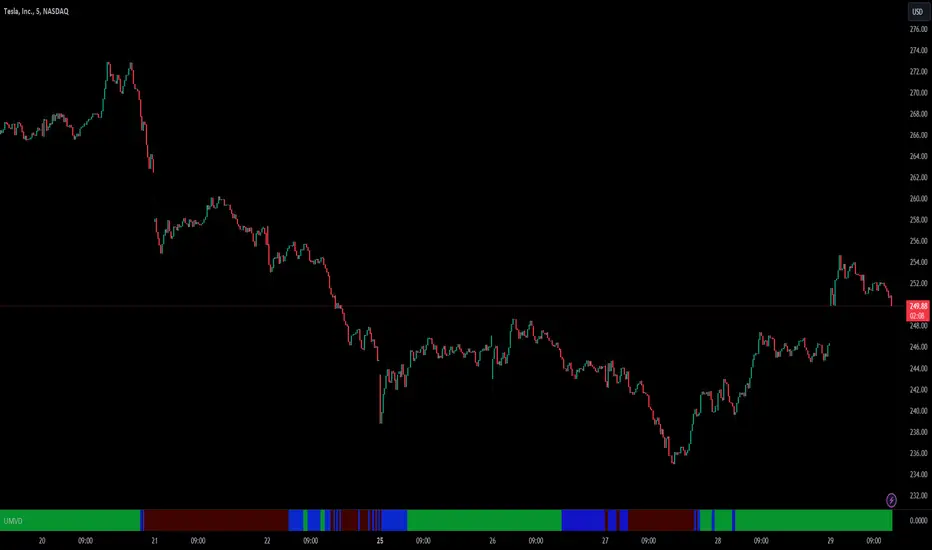
This script analyses the volume trends by utilizing changes in On Balance Volume (OBV) for the instrument and compares it with the price trend to color the lower panel on your chart window. The color changes as the direction of the OBV trend changes from Up to Down or vice versa. If there is a divergence between the price trend and volume trend, the color will switch to Purple.
Divergence in volume and price trends typically indicate a battle between supply and demand. This may coincide with a change in market direction as well. It is important to know which side won after this battle, as the market will follow that side.
This tool will alert traders of unusual market volume behavior and when both price & volume trends are in sync.
Features
How to use the Indicator while Trading?
Basic Set-Up
Please note: On-Balance Volume is a leading indicator but it doesn't provide specific information on exactly what happened or why. Also, a large spike in a single day may throw off the On Balance Volume for a while. Therefore we are focusing on its trend and comparing it with Price Trends for better effectiveness.
Price usually moves in lockstep with the volume trends i.e. price goes higher when there is buying and it goes down when there is selling in the market. But sometimes, the market behaves unusually i.e. Price and volume move in opposite directions. This indicator identifies precisely this divergent behavior in the market!
This script analyses the volume trends by utilizing changes in On Balance Volume (OBV) for the instrument and compares it with the price trend to color the lower panel on your chart window. The color changes as the direction of the OBV trend changes from Up to Down or vice versa. If there is a divergence between the price trend and volume trend, the color will switch to Purple.
Divergence in volume and price trends typically indicate a battle between supply and demand. This may coincide with a change in market direction as well. It is important to know which side won after this battle, as the market will follow that side.
This tool will alert traders of unusual market volume behavior and when both price & volume trends are in sync.
Features
- A Purple color in the lower panel indicates that the Volume and Price trends are diverging and are moving in the opposite direction
- A Green color in the lower panel indicates that the Volume is trending higher supporting bullish price action
- A Red color in the lower panel indicates that the Volume is trending lower supporting bearish price action
How to use the Indicator while Trading?
- When the Volume trend matches the price action (Trend), you have confirmation of your trade bias. Therefore when you are taking Long trades, you would want to see a Green color in the lower panel and a Red color when you are going Short.
- When a Divergence is identified by the tool, as Purple color in the lower panel, Trader can take the following steps:
- Take profit or partially close the position if you are in a Trade as this divergence presents
uncertainty
- Watch for which color comes up after divergence, that side of the market has a higher
probability of prevailing. For example, a Red color indicates Selling in the market and vice
versa.
- Divergence usually precedes a market direction change and therefore Trader can take this
into account when planning Trade bias and position size. Please note a divergence does
not always precede a reversal in the market and can be a temporary phenomenon with no
effect on the price action.
Basic Set-Up
- Add the Indicator to the chart
- You can change the default colors for Buying Volume, Selling Volume, and Divergence
- Use the “Regular Trading Hours” Session in the Chart Settings for the most effective analysis
Please note: On-Balance Volume is a leading indicator but it doesn't provide specific information on exactly what happened or why. Also, a large spike in a single day may throw off the On Balance Volume for a while. Therefore we are focusing on its trend and comparing it with Price Trends for better effectiveness.
僅限邀請腳本
僅作者批准的使用者才能訪問此腳本。您需要申請並獲得使用許可,通常需在付款後才能取得。更多詳情,請依照作者以下的指示操作,或直接聯絡SnowflakeTrader。
TradingView不建議在未完全信任作者並了解其運作方式的情況下購買或使用腳本。您也可以在我們的社群腳本中找到免費的開源替代方案。
作者的說明
Go To https://www.snowflaketrader.com/trader-resources to get access to this Indicator.
Visit snowflaketrader.com to get access to Free & Premium resources for Traders
Email : support@snowflaketrader.com
WhatsApp (Messages Only) : +1 341 345 8266
Discord : snowflaketrader
Email : support@snowflaketrader.com
WhatsApp (Messages Only) : +1 341 345 8266
Discord : snowflaketrader
免責聲明
這些資訊和出版物並非旨在提供,也不構成TradingView提供或認可的任何形式的財務、投資、交易或其他類型的建議或推薦。請閱讀使用條款以了解更多資訊。