PROTECTED SOURCE SCRIPT
Breakout Zones • No Repaint (Daily Levels)
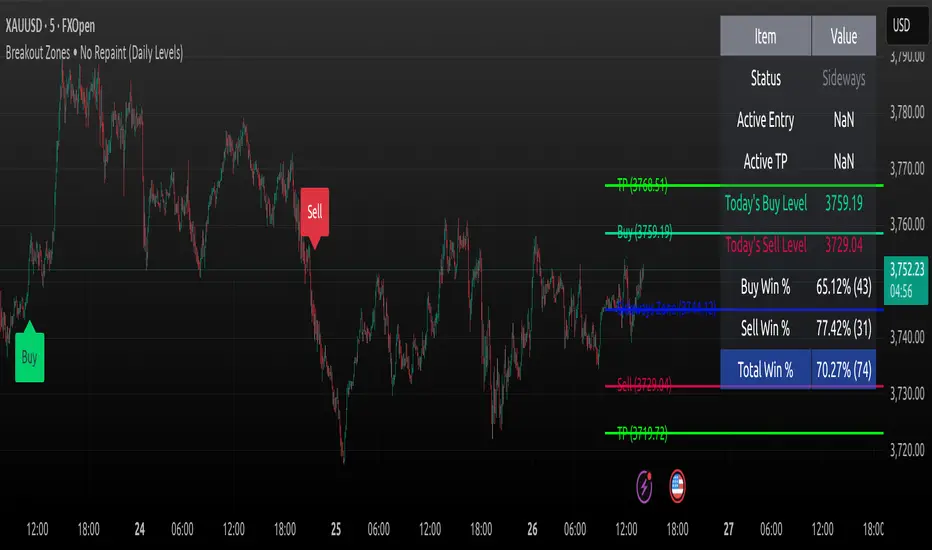
📌 Breakout Zones • No Repaint (Daily Levels)
This indicator is designed to help intraday and swing traders identify high-probability breakout levels based on the previous day’s price action. It uses pivot logic derived from the prior daily high, low, and close to generate precise Buy/Sell entries and Take Profit (TP) levels.
🧠 How It Works:
Daily Levels Calculation:
At the start of each trading day, the script calculates:
Sideways Zone = (Previous Day High + Low + Close) ÷ 3
Buy Entry (r1) = Sideways + 38.2% of yesterday’s range
Buy TP (r2) = Sideways + 61.8% of yesterday’s range
Sell Entry (s1) = Sideways – 38.2% of range
Sell TP (s2) = Sideways – 61.8% of range
Signals Generation (No Repaint):
A Buy Signal is generated when price closes above r1 (confirmed on the next candle).
A Sell Signal occurs when price closes below s1.
Signals are generated only once per day, ensuring clarity and avoiding noise.
Simulated Trade Tracking:
Each signal is tracked as a simulated trade.
If TP is hit (r2 or s2), it's counted as a win.
If TP isn't hit by the end of the day, it's a loss.
The system never repaints signals — what you see in backtest is what happened live.
Stop Loss Logic (Optional):
In strategy mode (not this script), SL can be set at the Sideways Zone (p) to manage risk.
📊 Live Trading Statistics:
A dynamic table updates in real-time, showing:
Current Trade Status (Buy Active, Sell Active, Sideways)
Today’s Entry & TP Levels
Historical Accuracy
Buy Win %
Sell Win %
Total Win %
Number of trades tracked (up to 300 lookback)
🔎 How to Use:
Add to your chart and switch to intraday timeframes like 5m, 15m, 1h.
Observe the Buy/Sell arrows and TP levels — they are confirmed signals, not repainting.
Use the accuracy table to gauge performance historically and for the current session.
Combine with volume, momentum, or trend filters for enhanced decision making.
🧩 Designed For:
Intraday scalpers looking for breakout zones
Swing traders analyzing daily structure
Users who want clean, reliable, non-repainting signals
Traders who prefer to visualize risk/reward zones automatically
🔒 About Access:
✅ This script is free to use, but source code is locked to preserve functionality, prevent tampering, and ensure clean performance for all users.
📢 Feedback Welcome!
We’re constantly improving the tool. If you find bugs, want new features, or have a use-case you'd like supported, just leave a comment.
➕ Add this indicator to your toolkit and stop chasing false breakouts.
📈 Let the chart tell you when a real opportunity forms — no repainting, no guesswork.
受保護腳本
此腳本以閉源形式發佈。 不過,您可以自由且不受任何限制地使用它 — 在此處了解更多資訊。
h e
免責聲明
這些資訊和出版物並不意味著也不構成TradingView提供或認可的金融、投資、交易或其他類型的意見或建議。請在使用條款閱讀更多資訊。
受保護腳本
此腳本以閉源形式發佈。 不過,您可以自由且不受任何限制地使用它 — 在此處了解更多資訊。
免責聲明
這些資訊和出版物並不意味著也不構成TradingView提供或認可的金融、投資、交易或其他類型的意見或建議。請在使用條款閱讀更多資訊。