OPEN-SOURCE SCRIPT
ka66: Gap Markers
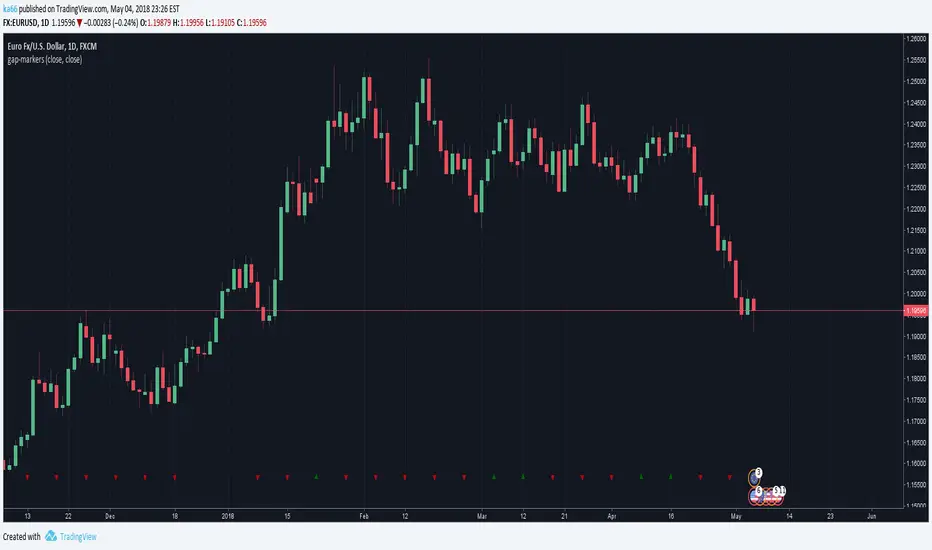
Marks bars having opening gaps, in either direction. Essentially where the opening price != closing price. The reference price defaults to close, but is configurable as an arbitrary source.
Larger gaps are easy to see visually but microgaps are more interesting, and indicate stronger shifts in sentiment, where enthusiasm towards a direction is increasing. They often signify the beginnings of strong trends.
Another signal when comparing open to high/low is a climactic type buy/sell.
Gapping is quite common in stocks, but not so much in 24H markets like Forex. It is expected this indicator has a much stronger value in these markets.
This indicator places up/down marks at the bottom of a chart, the rarity of these markers is a stronger signal than a higher frequency of occurrence.
Daily charts are likely the best spot for this indicator. Weeklies will almost always have gaps.
As usual, this is just one datapoint to consider among a confluence of others to verify a hypothesis.
Microgap Idea Credit, Price Action Course
開源腳本
本著TradingView的真正精神,此腳本的創建者將其開源,以便交易者可以查看和驗證其功能。向作者致敬!雖然您可以免費使用它,但請記住,重新發佈程式碼必須遵守我們的網站規則。
免責聲明
這些資訊和出版物並不意味著也不構成TradingView提供或認可的金融、投資、交易或其他類型的意見或建議。請在使用條款閱讀更多資訊。
免責聲明
這些資訊和出版物並不意味著也不構成TradingView提供或認可的金融、投資、交易或其他類型的意見或建議。請在使用條款閱讀更多資訊。