OPEN-SOURCE SCRIPT
CAPM Calculator [TrendX_]
CAPM calculator is a powerful tool that helps find the cost of equity, which is the minimum return that shareholders require to invest in a company.
With the CAPM calculator, you can assess how well your trading strategy performs compared to the market. The goal of your strategy is to earn higher returns than what you would get by investing in the market with the same level of risk. This is called the risk-adjusted cost of capital, and it represents the minimum return that you should accept for your investment.
USAGE
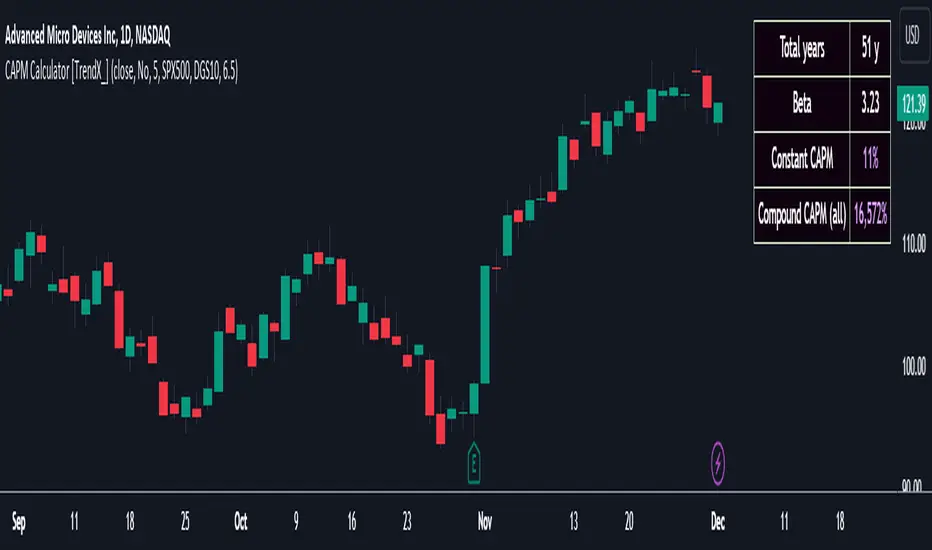
A simple way to measure this is to compare the Compound annual growth rate (CAGR) of the trading strategy with the “Compound CAPM”, which is the CAGR of investing in the market with the same beta as the strategy.
If the trading strategy has a higher CAGR than the “Compound CAPM”, it means that it has outperformed the market on a risk-adjusted basis.
This is a sign of an effective trading strategy.
DISCLAIMER
The results achieved in the past are not all reliable sources of what will happen in the future. There are many factors and uncertainties that can affect the outcome of any endeavor, and no one can guarantee or predict with certainty what will occur.
Therefore, you should always exercise caution and judgment when making decisions based on past performance.
With the CAPM calculator, you can assess how well your trading strategy performs compared to the market. The goal of your strategy is to earn higher returns than what you would get by investing in the market with the same level of risk. This is called the risk-adjusted cost of capital, and it represents the minimum return that you should accept for your investment.
USAGE
A simple way to measure this is to compare the Compound annual growth rate (CAGR) of the trading strategy with the “Compound CAPM”, which is the CAGR of investing in the market with the same beta as the strategy.
If the trading strategy has a higher CAGR than the “Compound CAPM”, it means that it has outperformed the market on a risk-adjusted basis.
This is a sign of an effective trading strategy.
DISCLAIMER
The results achieved in the past are not all reliable sources of what will happen in the future. There are many factors and uncertainties that can affect the outcome of any endeavor, and no one can guarantee or predict with certainty what will occur.
Therefore, you should always exercise caution and judgment when making decisions based on past performance.
開源腳本
秉持TradingView一貫精神,這個腳本的創作者將其設為開源,以便交易者檢視並驗證其功能。向作者致敬!您可以免費使用此腳本,但請注意,重新發佈代碼需遵守我們的社群規範。
免責聲明
這些資訊和出版物並非旨在提供,也不構成TradingView提供或認可的任何形式的財務、投資、交易或其他類型的建議或推薦。請閱讀使用條款以了解更多資訊。
免責聲明
這些資訊和出版物並非旨在提供,也不構成TradingView提供或認可的任何形式的財務、投資、交易或其他類型的建議或推薦。請閱讀使用條款以了解更多資訊。