PROTECTED SOURCE SCRIPT
Realtime Order Bubbles — cryptomonk
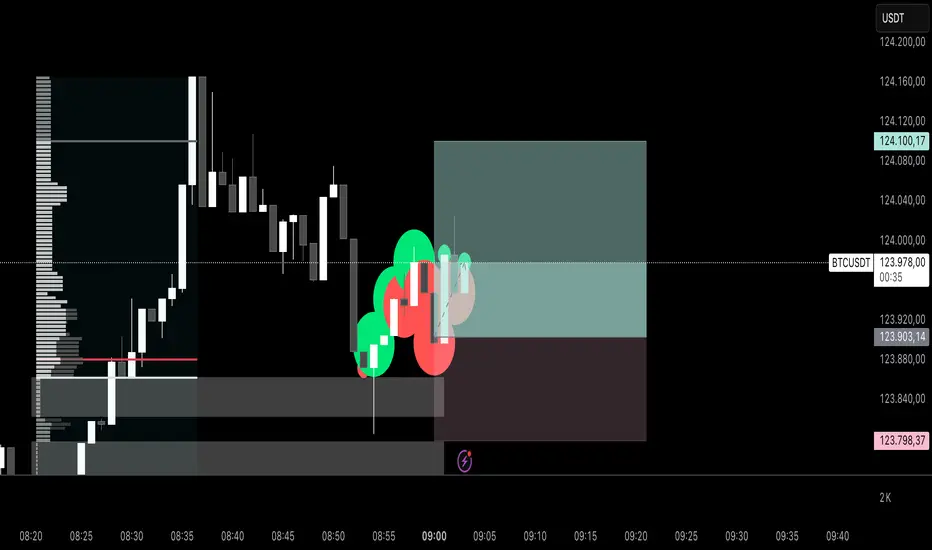
Description:
Displays real-time bubbles on the chart to visualize buy and sell activity within each candle.
• Green bubbles → Volume increase on upticks (buy pressure)
• Red bubbles → Volume increase on downticks (sell pressure)
• Bubble size → Strength of the volume change
How it works:
The indicator compares live tick updates (or bar closes) against previous volume and price values to detect whether a move was initiated by buyers or sellers, then plots bubbles in real-time accordingly.
Best used for:
• Scalping / Intraday analysis on lower timeframes (1–5 min)
• Detecting volume spikes, momentum shifts, and aggressive order flow
• Works best when chart is set to “Go Live” for tick-level updates
Use case:
A lightweight visual tool for identifying short-term order flow and understanding market pressure without needing full footprint data.
受保護腳本
此腳本以閉源形式發佈。 不過,您可以自由使用,沒有任何限制 — 點擊此處了解更多。
免責聲明
這些資訊和出版物並非旨在提供,也不構成TradingView提供或認可的任何形式的財務、投資、交易或其他類型的建議或推薦。請閱讀使用條款以了解更多資訊。
受保護腳本
此腳本以閉源形式發佈。 不過,您可以自由使用,沒有任何限制 — 點擊此處了解更多。
免責聲明
這些資訊和出版物並非旨在提供,也不構成TradingView提供或認可的任何形式的財務、投資、交易或其他類型的建議或推薦。請閱讀使用條款以了解更多資訊。