PROTECTED SOURCE SCRIPT
已更新 Strat Candles+Open Levels+Active FTFC
** YOU MUST READ BEFORE USING THIS INDICATOR **
This indicator is strictly for helping people like myself learn 'The Strat' method by Rob Smith. This indicator DOES NOT provide trading advice or trade entry signals!
Strat Candles+Open Levels+Active FTFC Indicator features :
How to use Active FTFC:
How to change Strat Candles, Open Price Level Labels/Price Lines and Active FTFC Candle Color's:
This indicator is strictly for helping people like myself learn 'The Strat' method by Rob Smith. This indicator DOES NOT provide trading advice or trade entry signals!
Strat Candles+Open Levels+Active FTFC Indicator features :
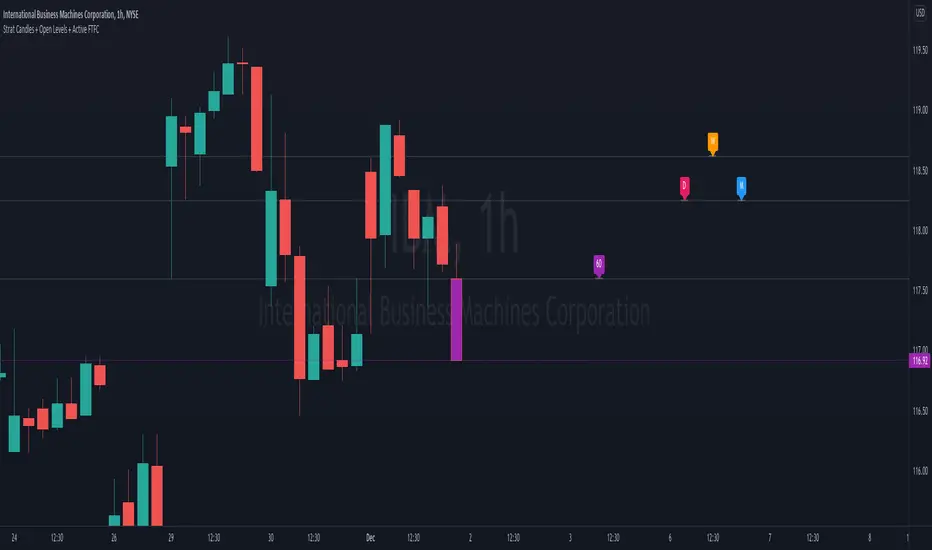
- Strat Candles Scenarios 1, 2 and 3.
- Open Price Levels for the 1min/5min/15/30/60/4HR/12HR/D/W/M/Q/Y
- Active FTFC (Full Timeframe Continuity) Function.
How to use Active FTFC:
- After you have added the indicator to your chart you must open the Indicator Settings. Select your Active FTFC Timeframe Group and Select your Candle Body Color for Bullish FTFC and Bearish FTFC. When FTFC is Active the candle body will change color when all FTFC conditions have been met across your selected Timeframes.
- For Active FTFC to work successfully only open the FIRST Timeframe chart listed within your selected group!
- If you select other Timeframes within your selected group Active FTFC results will be invalid. Example: If you have ticked and selected 'Active FTFC 60/D/W/M' you must only use the Active FTFC function on a 60min chart. If you then open a Daily chart the Active FTFC will not work correctly go back to the 60min chart.
- Please note this function only works on the current live candle not previous historical candles on the chart. Feel free to use Trading View's Replay feature on any chart with the Indicator to see how it works.
How to change Strat Candles, Open Price Level Labels/Price Lines and Active FTFC Candle Color's:
- - All color's are customisable within the Indicator Settings. After you choose your color's on the Inputs and Style pages make sure you click the drop down arrow next to 'Defaults' (bottom left of the indicator settings) and then click 'Save As Default' to save your personalised indicator preferences.
發行說明
Indicator Updated. Problem: Open Price Labels clashing on zoomed out/higher timeframe charts. Fix: Script adjusted, Open Price Labels now clean on higher timeframe charts.發行說明
Indicator demo image updated.發行說明
Quick update.- New colours added to Open price labels. Please note all colours can be changed via the indicator's settings.
- Open price labels moved closer to the current candles due users reporting labels too far to right of screen.
Remember to change your Bullish and Bearish candle colours when using the Active FTFC function so they don't blend in with your normal candle colours.
Also make sure you open the first timeframe for the Active FTFC function to work correctly.
Example:
If you select "Show Active FTFC 60/D/W/M" stay on the 60 chart. The candle will light up with your selected Bullish or Bearish colour when you have Full Timeframe Continuity.
If you select any chart with a timeframe before the 60 say a 1min, 5min, 15min, 30min the Active FTFC will not work unless you go into the indicator's setting and select "Show Active FTFC for the 15/30/60/D" etc.
發行說明
Indicator Settings Refresh受保護腳本
此腳本以閉源形式發佈。 不過,您可以自由使用,沒有任何限制 — 點擊此處了解更多。
免責聲明
這些資訊和出版物並非旨在提供,也不構成TradingView提供或認可的任何形式的財務、投資、交易或其他類型的建議或推薦。請閱讀使用條款以了解更多資訊。
受保護腳本
此腳本以閉源形式發佈。 不過,您可以自由使用,沒有任何限制 — 點擊此處了解更多。
免責聲明
這些資訊和出版物並非旨在提供,也不構成TradingView提供或認可的任何形式的財務、投資、交易或其他類型的建議或推薦。請閱讀使用條款以了解更多資訊。