PROTECTED SOURCE SCRIPT
ATR-Based Volatility SL/Target Planner (MTF Table)
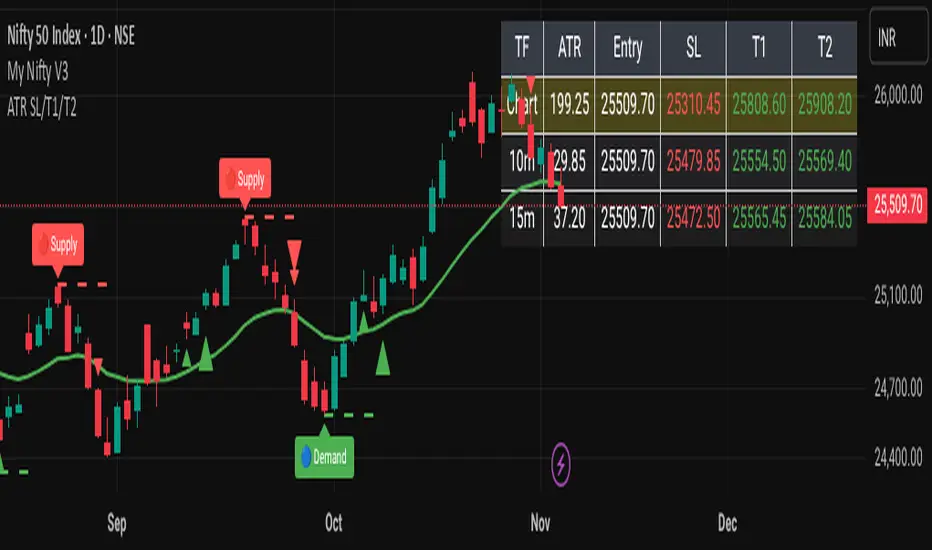
✅ ATR SL & Target Planner (MTF Table – Chart, 10m, 15m)
This indicator provides a clean multi-timeframe ATR table showing:
✅ ATR (Chart / 10m / 15m)
✅ Entry price (manual or auto)
✅ ATR-based Stop-Loss
✅ Target 1 & Target 2
✅ MTF level comparison
✅ High-contrast color-coded SL (Red) + Targets (Green)
✅ Selected timeframe highlighted automatically
Designed for intraday traders, positional traders, and volatility-based strategies.
✅ How to Use It
✅ 1. Choose Entry Mode
Manual Entry ON → Type your entry price
Manual Entry OFF → Last candle close is used
The script calculates ATR(14) on:
Current chart timeframe
10-minute timeframe
15-minute timeframe
Then it uses standard volatility-based formulas:
Stop-Loss = Entry ± (ATR × SL Multiplier)
Target 1 = Entry ± (ATR × T1 Multiplier)
Target 2 = Entry ± (ATR × T2 Multiplier)
Direction depends on Long/Short mode.
You can switch which ATR timeframe becomes active (affecting plotted lines + alerts).
✅ Why This Indicator Is Useful
This script solves 3 common problems:
✅ 1. “How wide should my stop-loss be?”
ATR automatically adjusts the SL to market volatility.
✅ 2. “Which timeframe ATR should I trust?”
You can compare Chart, 10m, and 15m in one panel.
✅ 3. “The table is too big in other indicators.”
This is compact, clean, color-coded, and readable.
Happy Trading :)
受保護腳本
此腳本以閉源形式發佈。 不過,您可以自由使用,沒有任何限制 — 點擊此處了解更多。
免責聲明
這些資訊和出版物並非旨在提供,也不構成TradingView提供或認可的任何形式的財務、投資、交易或其他類型的建議或推薦。請閱讀使用條款以了解更多資訊。
免責聲明
這些資訊和出版物並非旨在提供,也不構成TradingView提供或認可的任何形式的財務、投資、交易或其他類型的建議或推薦。請閱讀使用條款以了解更多資訊。