INVITE-ONLY SCRIPT
已更新 [VIP] ABCD Pattern
DESCRIPTION
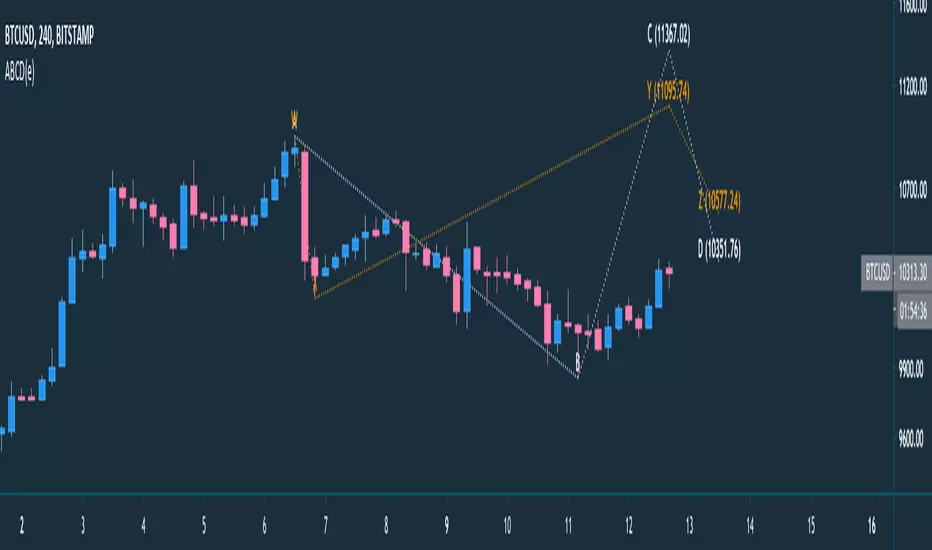
The AB=CD pattern is one of the most popular harmonic chart patterns.
Buy and sell signals are generated after the final C-to-D leg, when a reversal is expected to occur.
If the pattern is trending higher, you can look to sell or enter a short position at Point D.
If the pattern is trending lower, you can look to buy the security at Point D in anticipation of a turnaround.
Stop-loss points are best placed just above or below Point D, depending on the direction of the trade.
If the move extends beyond that point, the chart pattern is invalidated and the reversal is less likely to occur.
Take-profit points are typically placed using Fibonacci levels.
For example, you might look for a move back to the original Point A and move a trailing stop-loss to 28.2%, 50% and 61.8% Fibonacci levels along the way.
The AB=CD chart pattern works best when combined with other technical indicators or chart patterns, such as the relative strength index (RSI) or pivot points.
You may also want to use volume as a confirmation of a reversal once the AB=CD chart pattern makes a prediction.
CONFIGURATION
Please check link below for but report, trial and join with community
The AB=CD pattern is one of the most popular harmonic chart patterns.
Buy and sell signals are generated after the final C-to-D leg, when a reversal is expected to occur.
If the pattern is trending higher, you can look to sell or enter a short position at Point D.
If the pattern is trending lower, you can look to buy the security at Point D in anticipation of a turnaround.
Stop-loss points are best placed just above or below Point D, depending on the direction of the trade.
If the move extends beyond that point, the chart pattern is invalidated and the reversal is less likely to occur.
Take-profit points are typically placed using Fibonacci levels.
For example, you might look for a move back to the original Point A and move a trailing stop-loss to 28.2%, 50% and 61.8% Fibonacci levels along the way.
The AB=CD chart pattern works best when combined with other technical indicators or chart patterns, such as the relative strength index (RSI) or pivot points.
You may also want to use volume as a confirmation of a reversal once the AB=CD chart pattern makes a prediction.
CONFIGURATION
- Strategy ABCD :
- AB=CD : Leg AB is equal to leg CD
- Ratio : Formula to get leg CD by (AB/0.618) x 1.272 but if
- Forecast : is the continuity of ratio abcd, it is called ABCDE - Different between ABCD vs WXYZ, ABCD is harmonic pattern based on latest chart, but WXYZ based on previous preiodic
- Label style : Balloon will show with comment box, but Text just a simple character without comment shape
- Line style : default is dotted, available values are dashed, solid and dotted
- Colour : change line colour for line and text
- Show label : Display or hide label
Please check link below for but report, trial and join with community
發行說明
Update C and D tags Labels發行說明
bugfix calculation發行說明
Added forecast ab=cdFixed line CD issue on forecast
Fixed monthly chart issue
僅限邀請腳本
僅作者批准的使用者才能訪問此腳本。您需要申請並獲得使用許可,通常需在付款後才能取得。更多詳情,請依照作者以下的指示操作,或直接聯絡deSultanTM。
TradingView不建議在未完全信任作者並了解其運作方式的情況下購買或使用腳本。您也可以在我們的社群腳本中找到免費的開源替代方案。
作者的說明
免責聲明
這些資訊和出版物並非旨在提供,也不構成TradingView提供或認可的任何形式的財務、投資、交易或其他類型的建議或推薦。請閱讀使用條款以了解更多資訊。
僅限邀請腳本
僅作者批准的使用者才能訪問此腳本。您需要申請並獲得使用許可,通常需在付款後才能取得。更多詳情,請依照作者以下的指示操作,或直接聯絡deSultanTM。
TradingView不建議在未完全信任作者並了解其運作方式的情況下購買或使用腳本。您也可以在我們的社群腳本中找到免費的開源替代方案。
作者的說明
免責聲明
這些資訊和出版物並非旨在提供,也不構成TradingView提供或認可的任何形式的財務、投資、交易或其他類型的建議或推薦。請閱讀使用條款以了解更多資訊。