INVITE-ONLY SCRIPT
已更新 RPPI Futures & Indices Strategy Tester [SS Premium]
Hello everyone,
As promised, here is the strategy companion to the RPPI Futures & Indicies Indicator.
It contains all of the models of the RPPI but the functionality is all about back-testing the strategy. As such, you cannot use this to run probabilities, run autoregression assessments, or do any of the advanced RPPI features, this is solely to allow you to develop and implement a sustainable strategy in your trading using the RPI.
When you launch the indicator, in the settings menu, you will see toggles to customize the strategy you would like to apply:

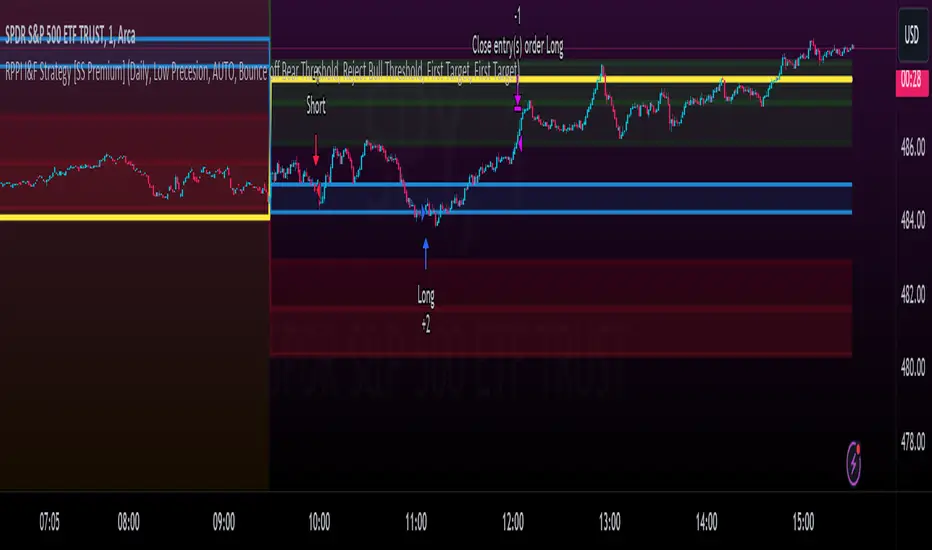
You can customize your short and long entries and your short and long exits and then review the backtest results of these various combinations.
From there, you can open up tradingview's strategy tester to see the immediate success of the strategy. If you want to test how effective your strategy is further back, you can make use of Tradingview's "Deep Backtesting" option. This allows you to select a start date way in the past, and back-test over numerous months / years, to see if the strategy has been sustainable in the long term.
To read more about the RPPI, you can check out its own page which lists the details of the indicator, how it works and how to use it. As a synopsis, the RPPI is a compendium indicator that contains various models of multiple futures and stocks. This is to attempt to accurately forecast daily, weekly, monthly, 3 month and annual moves on various futures and indices.
This strategy companion will help you hone in on ideal entries and exits and allow you to tailor them to each ticker that you are interested in trading, on whichever timeframe you are interested in trading.
Some important notes when applying the back-testing results:
1. If you are back-testing daily levels, it is recommended to use the 1 to 5-minute chart max.
2. iF you are back-testing weekly levels, it is recommended to use at least 15 to 30 minutes, up to 60 minute candles.
3. Monthly levels, its best to use 1 hour and up.
4. Greater than monthly, its best to use 3 to 4 hours, to daily candles and up.
As always, feel free to leave your questions or suggestions below.
Thank you for reading and, as always, safe trades!
As promised, here is the strategy companion to the RPPI Futures & Indicies Indicator.
It contains all of the models of the RPPI but the functionality is all about back-testing the strategy. As such, you cannot use this to run probabilities, run autoregression assessments, or do any of the advanced RPPI features, this is solely to allow you to develop and implement a sustainable strategy in your trading using the RPI.
When you launch the indicator, in the settings menu, you will see toggles to customize the strategy you would like to apply:
You can customize your short and long entries and your short and long exits and then review the backtest results of these various combinations.
From there, you can open up tradingview's strategy tester to see the immediate success of the strategy. If you want to test how effective your strategy is further back, you can make use of Tradingview's "Deep Backtesting" option. This allows you to select a start date way in the past, and back-test over numerous months / years, to see if the strategy has been sustainable in the long term.
To read more about the RPPI, you can check out its own page which lists the details of the indicator, how it works and how to use it. As a synopsis, the RPPI is a compendium indicator that contains various models of multiple futures and stocks. This is to attempt to accurately forecast daily, weekly, monthly, 3 month and annual moves on various futures and indices.
This strategy companion will help you hone in on ideal entries and exits and allow you to tailor them to each ticker that you are interested in trading, on whichever timeframe you are interested in trading.
Some important notes when applying the back-testing results:
1. If you are back-testing daily levels, it is recommended to use the 1 to 5-minute chart max.
2. iF you are back-testing weekly levels, it is recommended to use at least 15 to 30 minutes, up to 60 minute candles.
3. Monthly levels, its best to use 1 hour and up.
4. Greater than monthly, its best to use 3 to 4 hours, to daily candles and up.
As always, feel free to leave your questions or suggestions below.
Thank you for reading and, as always, safe trades!
發行說明
Added more backtest conditions that will permit you to modify the strategy in many, many more ways! 發行說明
Coding error in a long condition僅限邀請腳本
只有經作者授權的使用者才能訪問此腳本,且通常需付費。您可以將此腳本加入收藏,但需先向作者申請並獲得許可後才能使用 — 點擊此處了解更多。如需更多詳情,請依照作者說明或直接聯繫Steversteves。
除非您完全信任其作者並了解腳本的工作原理,否則TradingView不建議您付費或使用腳本。您也可以在我們的社群腳本中找到免費的開源替代方案。
作者的說明
To access this indicator, please contact the author or visit http://www.patreon.com/steversteves
提醒:在請求訪問權限之前,請閱讀僅限邀請腳本指南。
Easter sale starts April 18th for 50% off!
Get:
- Live Updates,
- Discord access,
- Access to my Proprietary Merlin Software,
- Access to premium indicators,
patreon.com/steversteves
Get:
- Live Updates,
- Discord access,
- Access to my Proprietary Merlin Software,
- Access to premium indicators,
patreon.com/steversteves
免責聲明
這些資訊和出版物並不意味著也不構成TradingView提供或認可的金融、投資、交易或其他類型的意見或建議。請在使用條款閱讀更多資訊。
僅限邀請腳本
只有經作者授權的使用者才能訪問此腳本,且通常需付費。您可以將此腳本加入收藏,但需先向作者申請並獲得許可後才能使用 — 點擊此處了解更多。如需更多詳情,請依照作者說明或直接聯繫Steversteves。
除非您完全信任其作者並了解腳本的工作原理,否則TradingView不建議您付費或使用腳本。您也可以在我們的社群腳本中找到免費的開源替代方案。
作者的說明
To access this indicator, please contact the author or visit http://www.patreon.com/steversteves
提醒:在請求訪問權限之前,請閱讀僅限邀請腳本指南。
Easter sale starts April 18th for 50% off!
Get:
- Live Updates,
- Discord access,
- Access to my Proprietary Merlin Software,
- Access to premium indicators,
patreon.com/steversteves
Get:
- Live Updates,
- Discord access,
- Access to my Proprietary Merlin Software,
- Access to premium indicators,
patreon.com/steversteves
免責聲明
這些資訊和出版物並不意味著也不構成TradingView提供或認可的金融、投資、交易或其他類型的意見或建議。請在使用條款閱讀更多資訊。