PROTECTED SOURCE SCRIPT
Custom RSI [Mr_Orange]
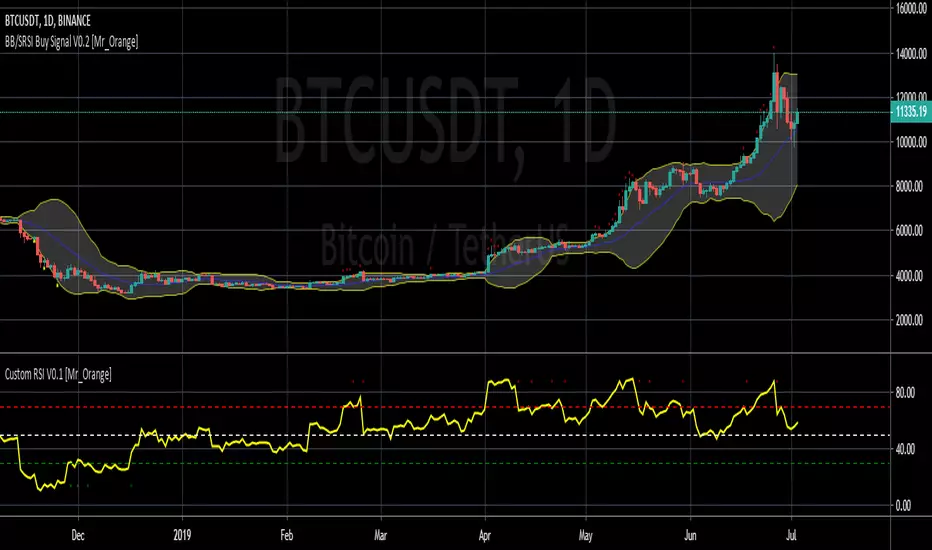
This is my custom RSI script, which is basically a normal RSI chart. Except it has build in alerts, based on the RSI strategy indicator, and I like the colors better.
* Buy signal is based on RSI crossunder from overbought to neutral zone
* Sell signal is based on RSI crossover from oversold to neutral zone
Both oversold and overbought can be adjusted. Future functionality will also include RSI rise and fall %
Thanks for checking it out! If you think it is worth something:
- BTC: 1NrG3Sy2VW8u4wWHucj1CQjKQ6hXYwbSyX
受保護腳本
此腳本以閉源形式發佈。 不過,您可以自由使用,沒有任何限制 — 點擊此處了解更多。
免責聲明
這些資訊和出版物並非旨在提供,也不構成TradingView提供或認可的任何形式的財務、投資、交易或其他類型的建議或推薦。請閱讀使用條款以了解更多資訊。
免責聲明
這些資訊和出版物並非旨在提供,也不構成TradingView提供或認可的任何形式的財務、投資、交易或其他類型的建議或推薦。請閱讀使用條款以了解更多資訊。