OPEN-SOURCE SCRIPT
Co-Relation by Onur
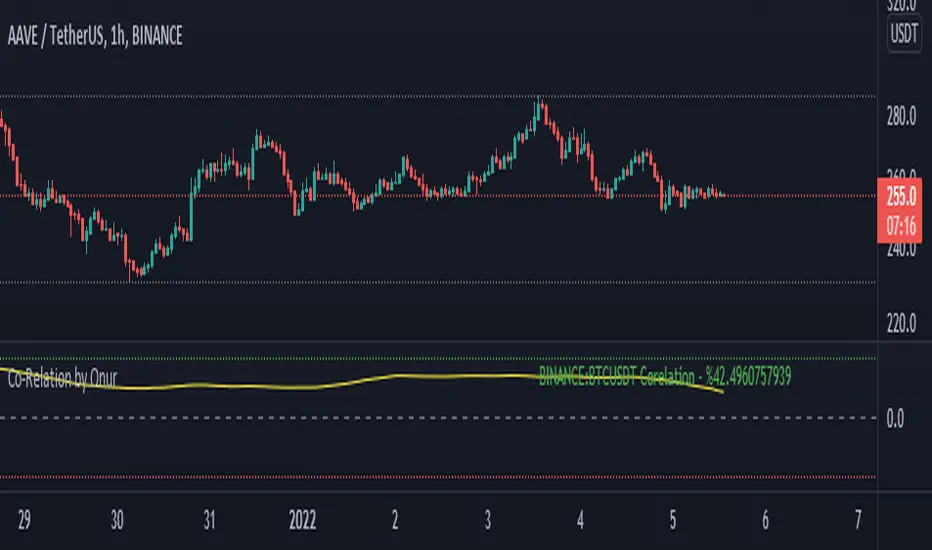
This indicator can statistically compare ANY asset in Tradingview with the asset in the active chart. It helps to understand positive or negative corelation btw 2 assets with percentage. Indicator value oscillates btw +100 and -100. If value is close to +100, there is a positive co-relation and if value is close to -100, there is a negative co-relation.
Indicator has 2 variables:
Symbol: The symbol (BTCUSDT by Default) that you'd like to compare with chart.
Period: Is the number of backward candles (200 by Default) for indicator co-relation calculation.
You can increase Period value to understand a long term relationship btw 2 assets.
Indicator has 2 variables:
Symbol: The symbol (BTCUSDT by Default) that you'd like to compare with chart.
Period: Is the number of backward candles (200 by Default) for indicator co-relation calculation.
You can increase Period value to understand a long term relationship btw 2 assets.
開源腳本
秉持TradingView一貫精神,這個腳本的創作者將其設為開源,以便交易者檢視並驗證其功能。向作者致敬!您可以免費使用此腳本,但請注意,重新發佈代碼需遵守我們的社群規範。
免責聲明
這些資訊和出版物並非旨在提供,也不構成TradingView提供或認可的任何形式的財務、投資、交易或其他類型的建議或推薦。請閱讀使用條款以了解更多資訊。
開源腳本
秉持TradingView一貫精神,這個腳本的創作者將其設為開源,以便交易者檢視並驗證其功能。向作者致敬!您可以免費使用此腳本,但請注意,重新發佈代碼需遵守我們的社群規範。
免責聲明
這些資訊和出版物並非旨在提供,也不構成TradingView提供或認可的任何形式的財務、投資、交易或其他類型的建議或推薦。請閱讀使用條款以了解更多資訊。