PROTECTED SOURCE SCRIPT
Double CCI & RSI Trigger
Warning : This strategy can only be implemented with 1 minute timeframe chart
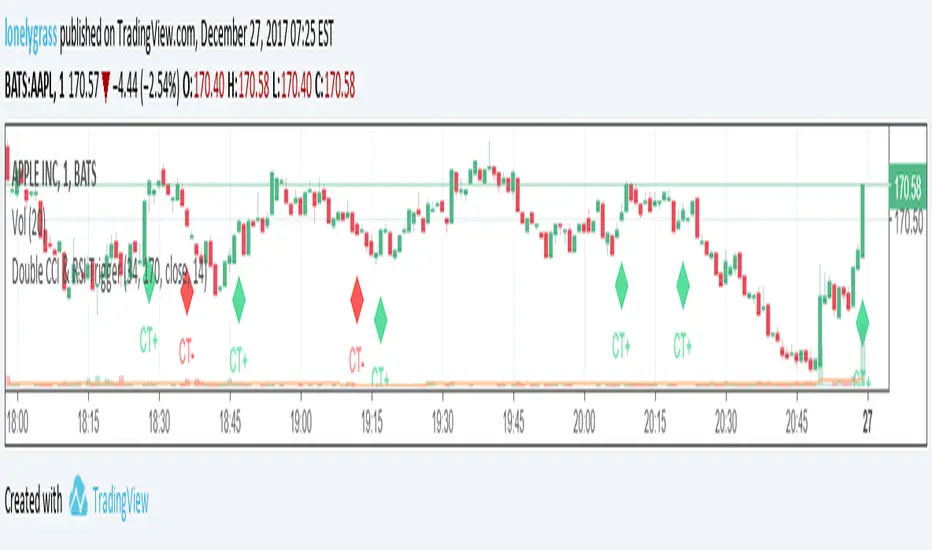
With the help of 2 CCI and 1 RSI, it is much easier to identify the market trend. The main idea of this EA is looking at a longer CCI (170 periods) and RSI (14 periods) and finding some possible bullish and bearish trends.
Bullish Conditions: 170 CCI has a value of above 0 and RSI 14 is larger than 30 (oversold)
Bearish Conditions: 170 CCI has a value of below 0 and RSI 14 is lower than 70 (overbought)
When conditions are met, CT+ (bullish) and CT- (bearish) signals will be shown on the graph.
To effectively adopt the system, users have to incorporate "Double CCI & RSI Alert" , my another script, into this and can decide whether or not to hold onto positions. Happy trading! Appreciate support and comments!
受保護腳本
此腳本以閉源形式發佈。 不過,您可以自由使用,沒有任何限制 — 點擊此處了解更多。
免責聲明
這些資訊和出版物並非旨在提供,也不構成TradingView提供或認可的任何形式的財務、投資、交易或其他類型的建議或推薦。請閱讀使用條款以了解更多資訊。
受保護腳本
此腳本以閉源形式發佈。 不過,您可以自由使用,沒有任何限制 — 點擊此處了解更多。
免責聲明
這些資訊和出版物並非旨在提供,也不構成TradingView提供或認可的任何形式的財務、投資、交易或其他類型的建議或推薦。請閱讀使用條款以了解更多資訊。