PROTECTED SOURCE SCRIPT
M2 Global G13 Liquidity (Custom & Shift, US DXY Adj.)
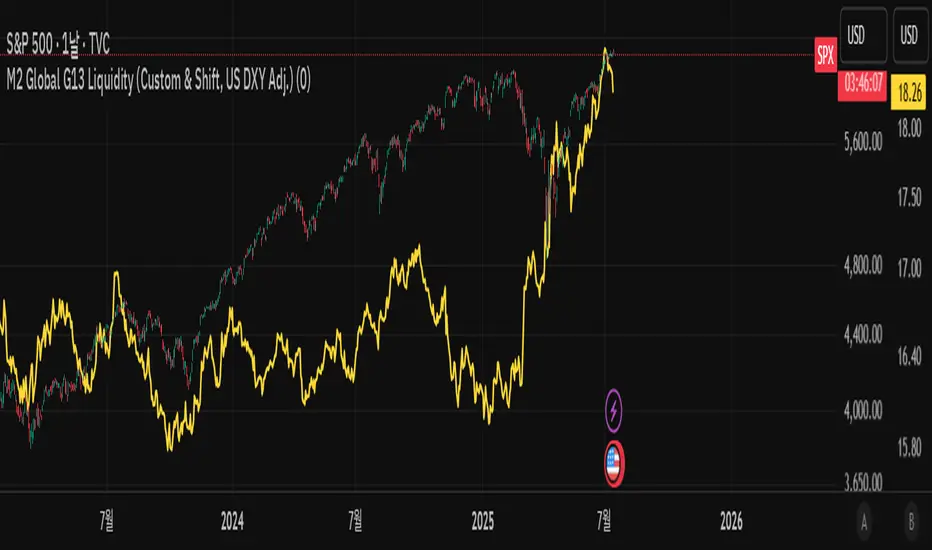
🌎 M2 Global G13 Liquidity index (Custom & Shift, US DXY Adj.)
💡 Indicator Overview
The M2 Global G13 Liquidity indicator combines the M2 liquidity of 13 major countries, allowing users to selectively include or exclude each country to visualize global capital flows and potential investment liquidity at a glance.
Each country's M2 data is converted to USD using real-time exchange rates, and the US M2 is further adjusted using the Dollar Index (DXY) to reflect the impact of dollar strength or weakness on US liquidity.
✅ What is M2?
M2 is a broad measure of money supply that includes cash, demand deposits, savings deposits, and certain financial products.
It represents a country's overall liquidity and capital supply and is often interpreted as "dry powder" ready to be deployed into various assets such as equities, real estate, and bonds.
Therefore, M2 serves as a crucial benchmark for assessing a country's potential investment capacity that can flow into markets at any time.
💰 Exchange Rate & Dollar Index Adjustment
- All country M2 data is converted from local currencies to USD.
- The US M2 is further adjusted using the Dollar Index (DXY) to better reflect its real global power:
- DXY > 100 → Liquidity contraction (strong dollar effect)
- DXY < 100 → Liquidity expansion (weak dollar effect)
🗺️ Country Selection Options
- Default selection: United States
- Major selections: China, Eurozone, Japan, United Kingdom (core G5 economies)
- Additional selections: Switzerland, Canada, India, Russia, Brazil, South Korea, Mexico, South Africa
- Users can freely add or remove countries to customize the indicator to match their analytical needs.
📈 Example Use Cases
- Monitor global capital flows: Track worldwide liquidity trends and detect potential market risk signals.
- Analyze exchange rate and monetary policy trends: Compare dollar strength with major central bank policies.
- Benchmark against equity indices: Evaluate correlations with MSCI World, KOSPI, NASDAQ, etc.
- Valuation analysis: Compare overall liquidity levels to equity index prices or market capitalization to assess relative valuation and identify potential overvaluation or undervaluation.
- Crisis response strategy: Identify liquidity contraction during global credit crises or deleveraging phases.
==================================================
🌎 M2 글로벌 G13 유동성 지수 (Custom & Shift, US DXY Adj.)
💡 지표 소개
M2 Global G13 Liquidity 지표는 세계 13개 주요국의 M2 유동성을 선택적으로 결합하여, 글로벌 자금 흐름과 잠재 투자 자금을 한눈에 시각화할 수 있도록 설계된 종합 유동성 지표입니다.
국가별 M2 데이터를 환율과 결합해 달러 기준으로 표준화하며, 특히 미국 M2는 달러지수(DXY)로 보정하여 달러 강약에 따른 파급력을 반영합니다.
✅ M2란?
M2는 광의 통화지표로, 현금 + 요구불 예금 + 저축성 예금 + 일부 금융상품을 포함합니다.
이는 한 국가의 유동성 수준과 자금 공급 상태를 나타내는 핵심 거시경제 지표이며, **주식·부동산·채권 등 다양한 자산에 투자될 준비가 된 '대기자금'**으로도 해석됩니다.
따라서 M2는 투자시장으로 언제든지 흘러들어갈 수 있는 잠재적 투자 역량을 평가할 때 중요한 기준입니다.
💰 환율 및 달러지수 보정
- 모든 국가 M2는 자국 통화에서 **달러(USD)**로 환산됩니다.
- 특히 미국 M2는 달러 가치의 글로벌 실질 파워를 평가하기 위해 DXY 보정을 적용합니다.
- DXY > 100 → 유동성 축소 (강달러 효과)
- DXY < 100 → 유동성 확대 (약달러 효과)
🗺️ 국가별 선택 옵션
- 기본 선택: 미국
- 주요 선택: 중국, 유로존, 일본, 영국 (주요 G5)
- 추가 선택: 스위스, 캐나다, 인도, 러시아, 브라질, 한국, 멕시코, 남아공
- 사용자는 각 국가를 자유롭게 더하거나 빼면서 커스터마이즈할 수 있습니다.
📈 활용 예시
- 글로벌 자금 흐름 모니터링: 전세계 유동성 추세 및 시장 리스크 신호 분석
- 환율/금리 정책 분석: 달러 강약과 주요국 정책 변화 비교
- 주가지수 벤치마크 비교: MSCI World, 코스피, 나스닥 등과 상관관계 확인
- 밸류에이션 분석: 전체 유동성 수준을 주가지수나 시가총액과 비교하여, 시장의 상대적 고평가·저평가 여부를 평가
- 위기 대응 전략: 글로벌 신용위기·자금 긴축 국면 대비
受保護腳本
此腳本以閉源形式發佈。 不過,您可以自由使用,沒有任何限制 — 點擊此處了解更多。
免責聲明
這些資訊和出版物並非旨在提供,也不構成TradingView提供或認可的任何形式的財務、投資、交易或其他類型的建議或推薦。請閱讀使用條款以了解更多資訊。
受保護腳本
此腳本以閉源形式發佈。 不過,您可以自由使用,沒有任何限制 — 點擊此處了解更多。
免責聲明
這些資訊和出版物並非旨在提供,也不構成TradingView提供或認可的任何形式的財務、投資、交易或其他類型的建議或推薦。請閱讀使用條款以了解更多資訊。