OPEN-SOURCE SCRIPT
Day25Range
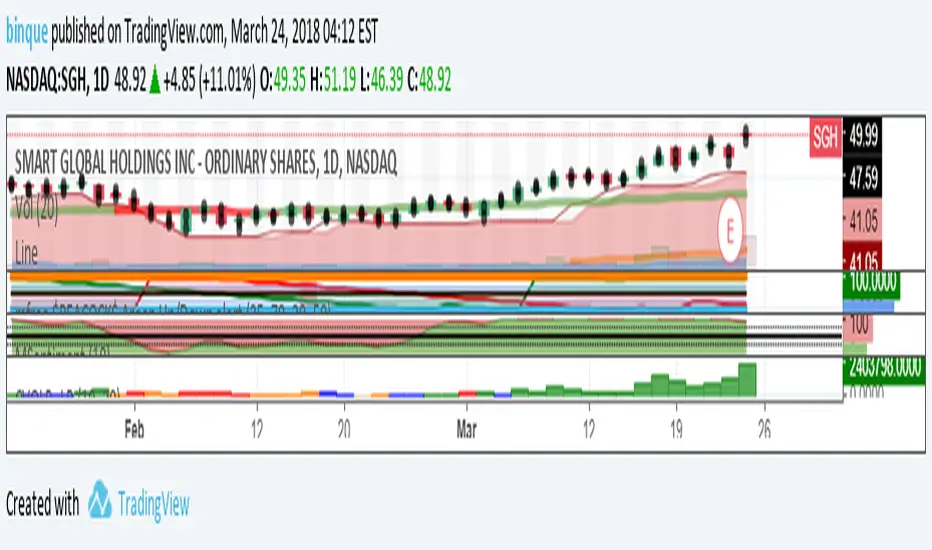
Day25Range(1) - Plot on the candle the 25% low range of the daily price. This helps to show when the current price is at or below the 25% price range of the day. Best when used with other indicators to show early wakening strength in price. On the attached chart, if you look at Jan 23, 2018 you will see a red candle that closed below the 25% mark of the trading day. For that day the 25% mark was at 38.66 and the close of the day was at 38.25 That indicators a potential start of a strong swing trade down. A second signal was given on Jan 25, 2018 when a red candle closed (37.25) below the 25% mark (38.08) again. Within the next few days a third weak indicator signaled on Jan 30,2018 with a close (35.88) below the Day25Range (37.46). price continued down from there for the next 4 days before starting to reverse. If the price closes below the 25% daily range as shown on the Day25Range(1) indicator, this could indicate a possible start of weakening in the price movement.
開源腳本
本著TradingView的真正精神,此腳本的創建者將其開源,以便交易者可以查看和驗證其功能。向作者致敬!雖然您可以免費使用它,但請記住,重新發佈程式碼必須遵守我們的網站規則。
免責聲明
這些資訊和出版物並不意味著也不構成TradingView提供或認可的金融、投資、交易或其他類型的意見或建議。請在使用條款閱讀更多資訊。
免責聲明
這些資訊和出版物並不意味著也不構成TradingView提供或認可的金融、投資、交易或其他類型的意見或建議。請在使用條款閱讀更多資訊。