INVITE-ONLY SCRIPT
[KICK] Smart OBVCD
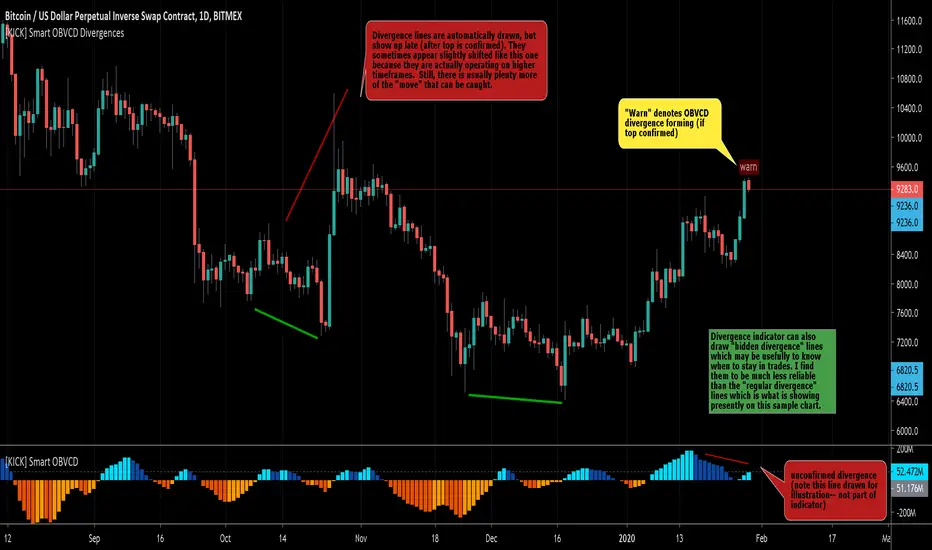
This indicator is part of a pair of indicators that make it easier to spot divergences in On Balance Volume, but make the calculations using a unique method. THIS ONE IS IN THE LOWER PANE OF THE SAMPLE CHART.
Volume is segmented into buy or sell volume by analyzing smaller timeframes (down to 1 minute)
The sell vs. buy volume is calculated as a running total (as per normal OBV calculations)
The Convergence/Divergence of the OBV Buy and Sell volumes are calculated and smoothed with 3rd generation averaging methods
The Smart OBVCD indicator (THIS ONE) visualizes the above calculation on a histogram to make it easier to see the values and how they relate to the price action.
The Smart OBVCD Divergence indicator (THE RELATED INDICATOR) plots Regular and Hidden Bullish and Bearish divergence on higher timeframes based on the calculations and also provides early “warnings” for unconfirmed divergences forming (note: these are unconfirmed because the higher high or lower low have now yet been confirmed on the higher timeframe).
Use the link below to watch a tutorial video, request a trial, or purchase for access.
僅限邀請腳本
僅作者批准的使用者才能訪問此腳本。您需要申請並獲得使用許可,通常需在付款後才能取得。更多詳情,請依照作者以下的指示操作,或直接聯絡CryptoKick。
TradingView不建議在未完全信任作者並了解其運作方式的情況下購買或使用腳本。您也可以在我們的社群腳本中找到免費的開源替代方案。
作者的說明
Visit Kick Studios for access to our paid and FREE indicators
kickstudios.com/tools
PineScript Indicator Development course
kickstudios.com/courses
Trading Discord Community (Apex Trades)
discord.gg/K5hFQKHaKr
kickstudios.com/tools
PineScript Indicator Development course
kickstudios.com/courses
Trading Discord Community (Apex Trades)
discord.gg/K5hFQKHaKr
免責聲明
這些資訊和出版物並非旨在提供,也不構成TradingView提供或認可的任何形式的財務、投資、交易或其他類型的建議或推薦。請閱讀使用條款以了解更多資訊。