PROTECTED SOURCE SCRIPT
Ori Volume Profile
Ori Volume Profile plots trading volume as a histogram on the price scale.
You can add it more than once to increase its precision.
It starts drawing from the bar it starts to calculate.
If you can't see the volume profile zoom out and go left in the chart until you can see the starting position.
For adding it multiple times you should set inputs correclty. For example if you want to add it 3 times, total indicator amount should be 3 in all of the 3 indicator and you should enumerate their order of the current amount. First indicators order should be 1, second indicators order should be 2, third indicators order should be 3 etc
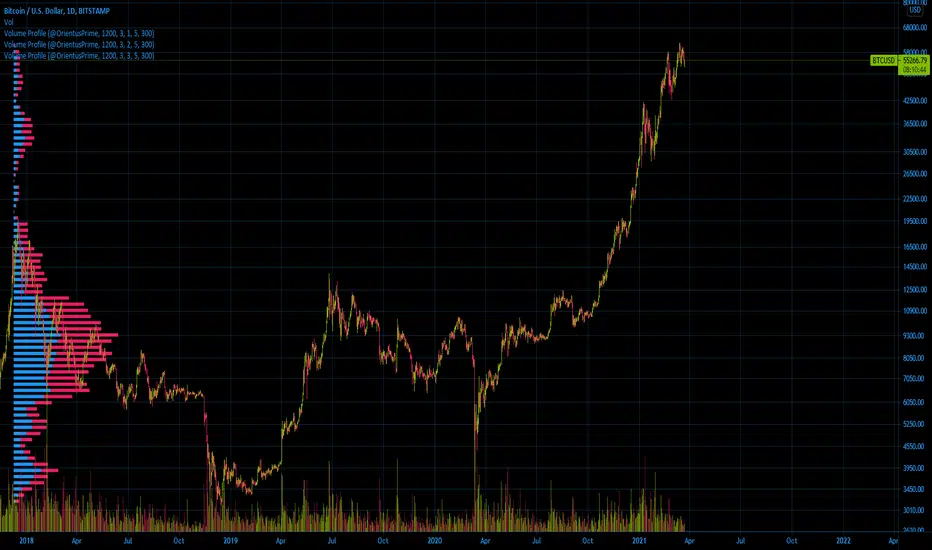
Settings for the one in the image:
Firs indicator: 1200 3 1 5 300
Second indicator:1200 3 2 5 300
Third indicator:1200 3 3 5 300
You can add it more than once to increase its precision.
It starts drawing from the bar it starts to calculate.
If you can't see the volume profile zoom out and go left in the chart until you can see the starting position.
For adding it multiple times you should set inputs correclty. For example if you want to add it 3 times, total indicator amount should be 3 in all of the 3 indicator and you should enumerate their order of the current amount. First indicators order should be 1, second indicators order should be 2, third indicators order should be 3 etc
Settings for the one in the image:
Firs indicator: 1200 3 1 5 300
Second indicator:1200 3 2 5 300
Third indicator:1200 3 3 5 300
受保護腳本
此腳本以閉源形式發佈。 不過,您可以自由使用,沒有任何限制 — 點擊此處了解更多。
免責聲明
這些資訊和出版物並非旨在提供,也不構成TradingView提供或認可的任何形式的財務、投資、交易或其他類型的建議或推薦。請閱讀使用條款以了解更多資訊。
受保護腳本
此腳本以閉源形式發佈。 不過,您可以自由使用,沒有任何限制 — 點擊此處了解更多。
免責聲明
這些資訊和出版物並非旨在提供,也不構成TradingView提供或認可的任何形式的財務、投資、交易或其他類型的建議或推薦。請閱讀使用條款以了解更多資訊。