INVITE-ONLY SCRIPT
已更新 GapUp and GapDown with Candle [MV]

This Indicator Session Time is Indian NSE and BSE Equity Market
How to work This Indicator?
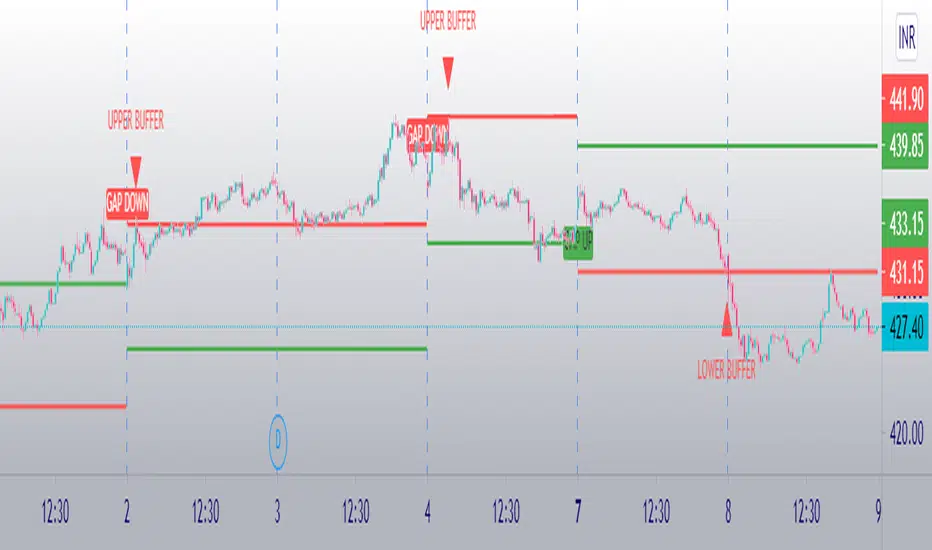
1. Buy plot When Market Gap Down and First Candle is Red (Close < Open).
2. Sell plot When Market Gap Up and First Candle is Green (Close > Open).
Note: This Indicator Repainted you Can also avoid Choose Once Per Bar Close in Alerts
If You Have Any Suggestion Please Mention There.
Below one image From Buy-side
發行說明
Now You Can Add GapUp and GapDown % Condition By default 0 Percentage. Calculate By GapUp and GapDown Percentage Previous Day Close Price.發行說明
indicator fully updated now its working with Gap up or Gap downTake profit and stoploss also available with alerts
more update comming soon
僅限邀請腳本
僅作者批准的使用者才能訪問此腳本。您需要申請並獲得使用許可,通常需在付款後才能取得。更多詳情,請依照作者以下的指示操作,或直接聯絡Manoj-verma。
TradingView不建議在未完全信任作者並了解其運作方式的情況下購買或使用腳本。您也可以在我們的社群腳本中找到免費的開源替代方案。
作者的說明
Important: This Indicator we are using for Automation Trading if You Want This Indicator Access, Please Contact me PM on Tradingview
Questions to ask for subject access request responses, suggestions You Can Reach Out to me Using Below
Tradingview: tradingview.com/u/Manoj-verma/
Telegram ID: t.me/MVyoutube
Tradingview: tradingview.com/u/Manoj-verma/
Telegram ID: t.me/MVyoutube
免責聲明
這些資訊和出版物並非旨在提供,也不構成TradingView提供或認可的任何形式的財務、投資、交易或其他類型的建議或推薦。請閱讀使用條款以了解更多資訊。