INVITE-ONLY SCRIPT
已更新 Q-Bar Signals
Hello Traders & Q Zoners
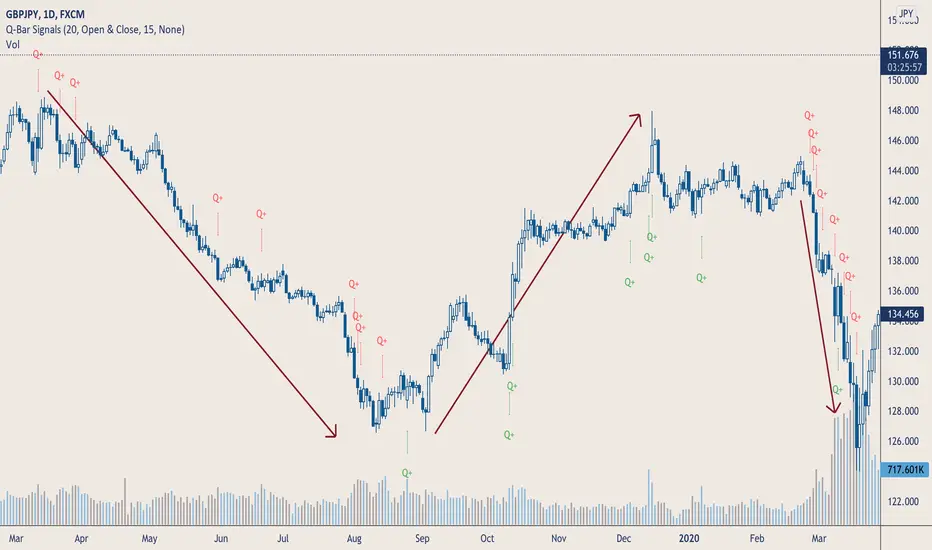
I introduce to you my latest indicator “Q-Bar Signals”. This indicator compares candlestick sizes as well as volume levels to check if latest candle is greater in both size and volume to a user-defined set of bars back.
Condition 1: For bullish candles, the indicator will measure the candlestick size of x number of bearish candles back and take the average size. It then takes the size of the bullish candle and if it is bigger than the average of x number of bearish candles, then it will display a green “Q” below that bullish candle. The opposite signal is true for bearish candles, displaying a red “Q” above the candlestick when the bearish candle is larger in size than the average number of bullish candles back.
Condition 2: The second part of this indicator compares volume. If a candlestick has met the first condition, it will also measure the volume of that candlestick and compare it to the volumes of a user-defined number of bars back. If the candlestick is bullish, it will look at the last x number of bearish volume bars and check if the bullish volume is higher than the highest volume of the bearish candles. If the condition is met, a green “Q+” will appear below the candle for bullish candles, and a red “Q+” will appear above the candle for bearish candles.
The user has a few different input options as well as alerts:
- Number of bars back to measure candlestick size from and take its average
- The candlestick measurement method: Between high to low, between open to close, or between the high/low to close (bullish candles measured between low to close, bearish candles measured between high to close)
- Number of bars back to check highest volume from and compare to current candlestick volume.
- Option to show only Q signals or both Q+ signals.
- Alerts for when signal first appears.
The signal waits for the candle to close and will then display signal and/or alert on the very opening of the next bar.
Tooltips have been added to the Q and Q+ labels which will display information containing the candlestick sizes and volume sizes to show you how the calculation is being performed and how big the differences are.
This indicator is meant to be used in conjunction with other tools and methods to help traders spot significant changes in price action and volume spikes.
Enjoy!
發行說明
Minor UpdateMore accuracy applied on measurement method
僅限邀請腳本
僅作者批准的使用者才能訪問此腳本。您需要申請並獲得使用許可,通常需在付款後才能取得。更多詳情,請依照作者以下的指示操作,或直接聯絡The_Q_Zones。
TradingView不建議在未完全信任作者並了解其運作方式的情況下購買或使用腳本。您也可以在我們的社群腳本中找到免費的開源替代方案。
作者的說明
For more inquiries on below e-mail
Info@theqzones.com
免責聲明
這些資訊和出版物並非旨在提供,也不構成TradingView提供或認可的任何形式的財務、投資、交易或其他類型的建議或推薦。請閱讀使用條款以了解更多資訊。
僅限邀請腳本
僅作者批准的使用者才能訪問此腳本。您需要申請並獲得使用許可,通常需在付款後才能取得。更多詳情,請依照作者以下的指示操作,或直接聯絡The_Q_Zones。
TradingView不建議在未完全信任作者並了解其運作方式的情況下購買或使用腳本。您也可以在我們的社群腳本中找到免費的開源替代方案。
作者的說明
For more inquiries on below e-mail
Info@theqzones.com
免責聲明
這些資訊和出版物並非旨在提供,也不構成TradingView提供或認可的任何形式的財務、投資、交易或其他類型的建議或推薦。請閱讀使用條款以了解更多資訊。