INVITE-ONLY SCRIPT
已更新 G-Ron TrendCloud
Overview
The G-Ron TrendCloud Indicator is a powerful trading tool designed to identify trend momentum and potential reversals across multiple timeframes. Using cloud-based visualizations, this indicator provides clear, actionable signals, making it ideal for all traders.
How Does It Work?
The G-Ron TrendCloud uses advanced differential calculations to pinpoint key momentum levels in the market. It identifies both trend continuation and reversals, highlighting strong momentum shifts with clear visual cues.
Key Features
The three components change color dynamically based on market conditions:
What Makes It Unique?
Many indicators rely on simple or exponential moving average crossovers. In contrast, the G-Ron TrendCloud utilizes differential equations to analyze the interaction between moving averages and pinpoint the precise price levels where significant momentum shifts—referred to as trend pivots—are likely to occur. These trend pivots are categorized by both term (short, medium, long) and direction (continuation or reversal). It's crucial to note that the components of the G-Ron TrendCloud are not moving averages, making it impossible to replicate its insights using any SMA or EMA settings.
Understanding The Components
How To Use It
Recommended Settings
The Long-Term Timeframe interval setting should always be at least three times bigger than the current timeframe displayed on your chart.
Why It’s Invite Only
The G-Ron TrendCloud utilizes a unique methodology that cannot be replicated by standard indicators. It provides valuable insights and clear visual cues to help traders accurately identify market trends. It greatly improves decision making and timing for both trade entries and exits, increasing the likelihood of successful outcomes.
Please see the authors instructions below to get instant access to this indicator.
The G-Ron TrendCloud Indicator is a powerful trading tool designed to identify trend momentum and potential reversals across multiple timeframes. Using cloud-based visualizations, this indicator provides clear, actionable signals, making it ideal for all traders.
How Does It Work?
The G-Ron TrendCloud uses advanced differential calculations to pinpoint key momentum levels in the market. It identifies both trend continuation and reversals, highlighting strong momentum shifts with clear visual cues.
Key Features
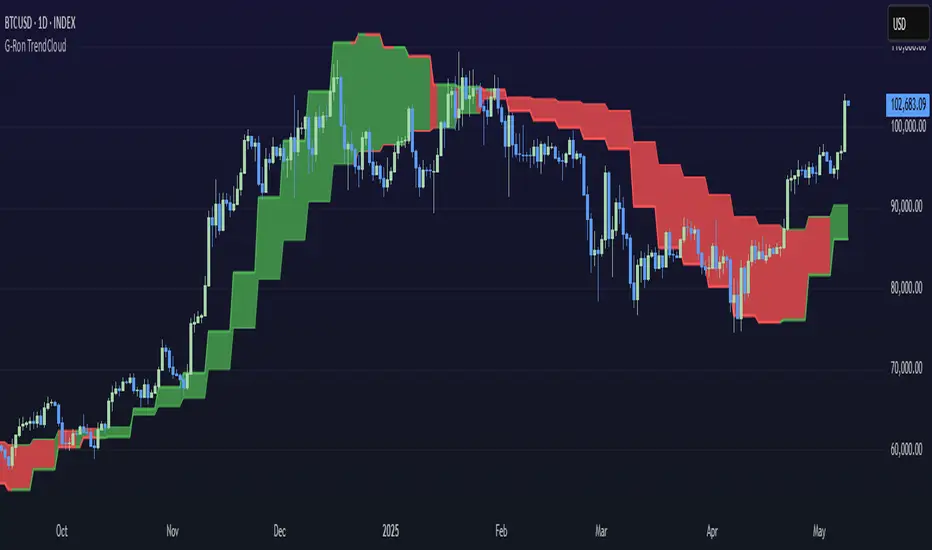
- Trend Cloud – This cloud highlights the dominant market trend, indicating whether the market is trending upwards or downwards.
- Reversal Cloud – This cloud provides early warning signals of potential trend reversals, helping traders time entries and exits more effectively.
- Trend Reversion Line – This line acts as a key pivot point in the market, indicating where the long-term trend is likely to shift.
The three components change color dynamically based on market conditions:
- Yellow for uptrends
- Red for downtrends
What Makes It Unique?
Many indicators rely on simple or exponential moving average crossovers. In contrast, the G-Ron TrendCloud utilizes differential equations to analyze the interaction between moving averages and pinpoint the precise price levels where significant momentum shifts—referred to as trend pivots—are likely to occur. These trend pivots are categorized by both term (short, medium, long) and direction (continuation or reversal). It's crucial to note that the components of the G-Ron TrendCloud are not moving averages, making it impossible to replicate its insights using any SMA or EMA settings.
Understanding The Components
- Trend Cloud: represents the area between the short-term trend pivot line and the medium-term trend pivot line. It illustrates the prevailing market trend.
- Reversal Cloud: represents the area between the medium-term trend pivot line and the reversal pivot line. It provides insights into the strength of the trend.
- Trend Reversion Line: the long-term trend pivot line which acts as a mean reversion for the Trend Cloud.
How To Use It
- Trend Continuation: When price is above or within the yellow Trend Cloud it signals a strong bullish trend continuation. When price is below or within the red Trend Cloud it signals a strong bearish trend continuation.
- Reversal Signals: When price breaks through the Reversal Cloud it signals a change in the prevailing market trend.
- Long-Term Confirmation: Bullish trends are stronger, and price is more likely to continue higher when the Trend Reversion Line is yellow. Bearish trends are stronger, and price is more likely to continue lower when the Trend Reversion Line is red.
- Multi-Timeframe View: For deeper insights, use the indicator across various timeframes. Shorter timeframes are ideal for intraday trades, while longer timeframes offer better signals for position traders.
Recommended Settings
The Long-Term Timeframe interval setting should always be at least three times bigger than the current timeframe displayed on your chart.
Why It’s Invite Only
The G-Ron TrendCloud utilizes a unique methodology that cannot be replicated by standard indicators. It provides valuable insights and clear visual cues to help traders accurately identify market trends. It greatly improves decision making and timing for both trade entries and exits, increasing the likelihood of successful outcomes.
Please see the authors instructions below to get instant access to this indicator.
發行說明
Update [04/11/2024]- timeframe setting automated
- default colors updated
- added extreme trend pivot line
發行說明
Update [07/11/2024]- default settings amended
- color settings updated
發行說明
Update [12/11/2024]- timeframe setting updated
發行說明
Update [14/11/2024]- applied timeframe setting fix
- extreme trend pivot line removed
發行說明
Update [20/11/2024]- added investor mode
發行說明
Update [18/12/2024]- removed investor mode
發行說明
Update [01/04/2025]- timeframe setting updated
發行說明
Update [09/05/2025]- tick functionality added
僅限邀請腳本
僅作者批准的使用者才能訪問此腳本。您需要申請並獲得使用許可,通常需在付款後才能取得。更多詳情,請依照作者以下的指示操作,或直接聯絡C0bb。
TradingView不建議在未完全信任作者並了解其運作方式的情況下購買或使用腳本。您也可以在我們的社群腳本中找到免費的開源替代方案。
作者的說明
Trial version on request. Get instant access here: http://www.patreon.com/GRonTrendCloud
Follow me on X: x.com/TraderC0bb
Unlock indicator: patreon.com/GRonTrendCloud
Unlock indicator: patreon.com/GRonTrendCloud
免責聲明
這些資訊和出版物並非旨在提供,也不構成TradingView提供或認可的任何形式的財務、投資、交易或其他類型的建議或推薦。請閱讀使用條款以了解更多資訊。