INVITE-ONLY SCRIPT
已更新 Waves Timeframe
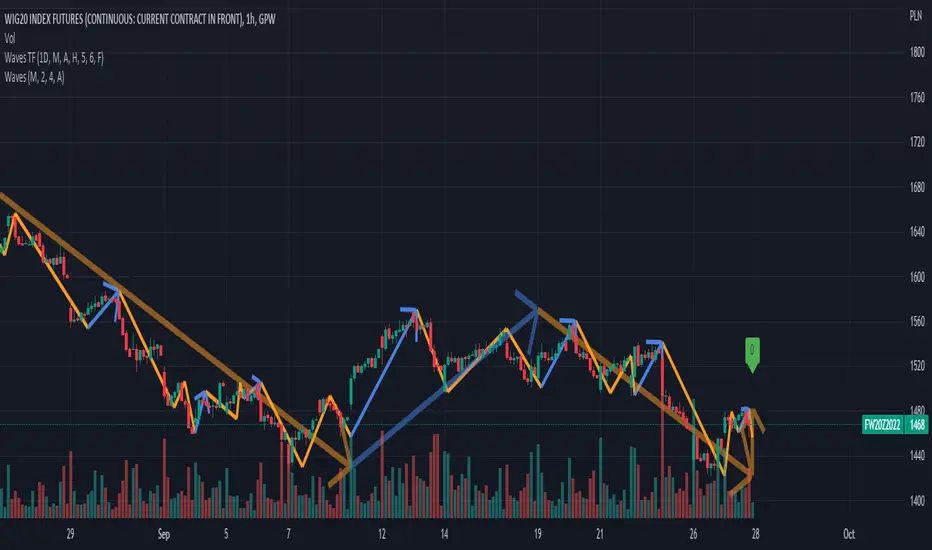
Custom timeframe trend wisualization tool in Wave theory. In script setting you can specify based on which timeframe (1D by default) data visaulizaction will be made. It's usefull in short time/day traiding where on the small interval you would like to see more global/bigger interval situation. If it's you case, please check "Waves Pro Trends", that gives posibility to easie check up to 3 different intervals.
Script settings:
• Timeframe – The interval based on which waves are calculated. Script is working correct only for intervals that are equal or more precise than picked here value. In case of picking lower interval than current, error message will appear.
• Type – Type of waves that are drawn:
o H(ide) – Not drawing any waves
o L(ow) – Drawing low level waves
o M(edium) – Drawing mid level waves
o B(oth) – Drawing both low and mid level waves
• Alfred – Showing extra informations about waves in the context of current candle.
• Wave – How script should visualize wave:
o H(ide) - Not drawing waves.
o S(olid line) – Drawng as solid line
o A (Solid line with Arrow) – Drawing as solid line with arrow
o D(otted line) – Drawing as dotted line.
• Shadow – How script should visualise wave shadows. Waves shadow it's a drawing mode in which wave is draw based on it's extrems instead of moment od detection.
o H(ide) - Do not draw any shadows
o S(olid line) – Draw with a solid line
o A (Solid line with Arrow) – Draw as solid line with arrorw
o D(otted line) – Draw as dotted line
• Low line – Color and line width for low level waves
• Medium line – Color and line width for mid level waves
• Impuls – Color and picking impuls mode:
o H(idden) – Do not show impuls
o F(irst) – Impuls is draw starting from the first wave up
o S(econd) – Impuls jis draw starting from the second wave up
o Auto – The algorithm performs an automatic analysis and selects which of the impulse drawing methods presents impulses with greater price dynamics.
發行說明
Package of improvements:- Fix problem with unconsistent real time data.
- Update trend visualization settings.
僅限邀請腳本
僅作者批准的使用者才能訪問此腳本。您需要申請並獲得使用許可,通常需在付款後才能取得。更多詳情,請依照作者以下的指示操作,或直接聯絡Investor_R。
TradingView不建議在未完全信任作者並了解其運作方式的情況下購買或使用腳本。您也可以在我們的社群腳本中找到免費的開源替代方案。
作者的說明
Latest instructions always on Youtube and blog page.
Write to toolkit4trading@gmail.com to get access.
To get access or report problem write on toolkit4trading@proton.me
More details on Website and Youtube.
More details on Website and Youtube.
免責聲明
這些資訊和出版物並非旨在提供,也不構成TradingView提供或認可的任何形式的財務、投資、交易或其他類型的建議或推薦。請閱讀使用條款以了解更多資訊。