PROTECTED SOURCE SCRIPT
Sumon Pal Volume Osc
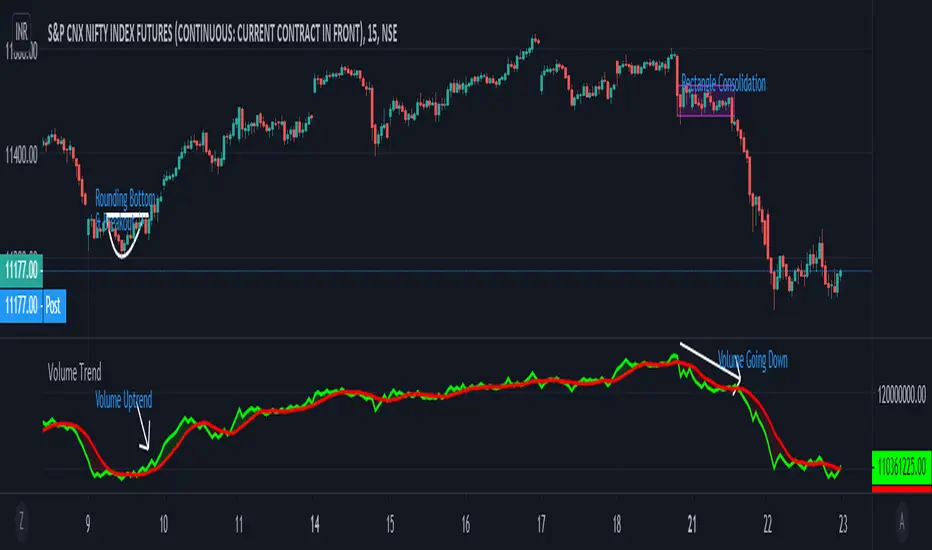
This is a volume oscillator calculated by the volume action on each bar price movement over a period of time.
When the short term volume(green line) is above the long term volume line(red)it indicates volume is coming and buying pressure may be observed.
Similarly when the short term volume is below the long term, volume is getting liquidated and selling pressure may be observed.
This indicator alone can't be used for buying or selling decision. This indicator can be used along with price action break out or break down level to get an idea whether volume is supporting the break out/down or not.
Disclaimer: Backtest this indicator with price action over a period of time and understand how it works before taking any trading decision. Trading in equity is always risky. Asses your risk profile and trade by managing proper risk.
受保護腳本
此腳本以閉源形式發佈。 不過,您可以自由使用,沒有任何限制 — 點擊此處了解更多。
免責聲明
這些資訊和出版物並非旨在提供,也不構成TradingView提供或認可的任何形式的財務、投資、交易或其他類型的建議或推薦。請閱讀使用條款以了解更多資訊。
免責聲明
這些資訊和出版物並非旨在提供,也不構成TradingView提供或認可的任何形式的財務、投資、交易或其他類型的建議或推薦。請閱讀使用條款以了解更多資訊。