OPEN-SOURCE SCRIPT
Extreme Volumes
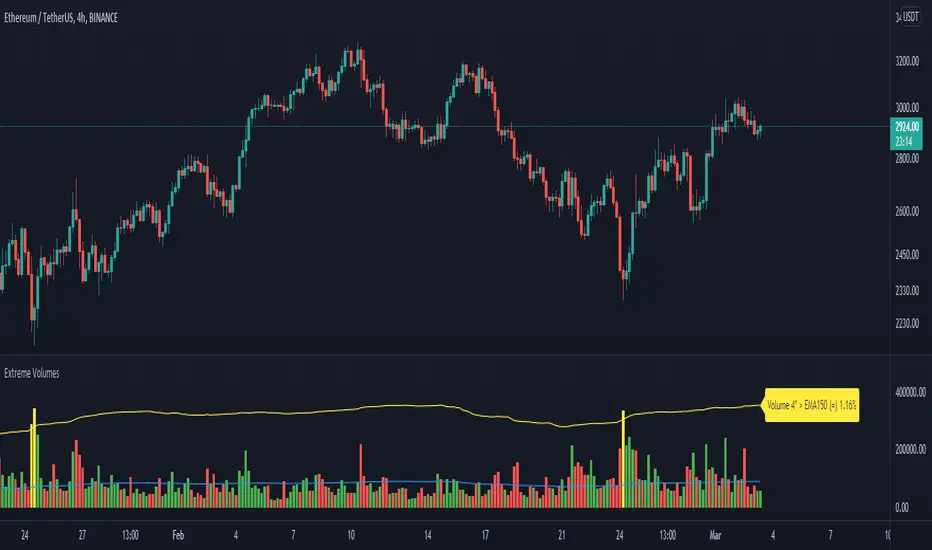
The aim of this volume indicator is quite simple: to pinpoint extreme volume spikes and how unusual these extremes are in comparison to all the chart's volumes.
The label displayed at the end of the indicator updates according to the settings you choose;
It shows the volume EMA length and how many times (the EMA) the current volume bar as to be above to be considered extreme.
Finally, the percentage at the end of the label tells how unusual the defined extreme volumes are compared to the whole chart's volumes (the smaller the percentage, the more unusual these "extreme" volumes are).
開源腳本
秉持TradingView一貫精神,這個腳本的創作者將其設為開源,以便交易者檢視並驗證其功能。向作者致敬!您可以免費使用此腳本,但請注意,重新發佈代碼需遵守我們的社群規範。
免責聲明
這些資訊和出版物並非旨在提供,也不構成TradingView提供或認可的任何形式的財務、投資、交易或其他類型的建議或推薦。請閱讀使用條款以了解更多資訊。
開源腳本
秉持TradingView一貫精神,這個腳本的創作者將其設為開源,以便交易者檢視並驗證其功能。向作者致敬!您可以免費使用此腳本,但請注意,重新發佈代碼需遵守我們的社群規範。
免責聲明
這些資訊和出版物並非旨在提供,也不構成TradingView提供或認可的任何形式的財務、投資、交易或其他類型的建議或推薦。請閱讀使用條款以了解更多資訊。