INVITE-ONLY SCRIPT
Ultimate ICT [smart-money-indicators]
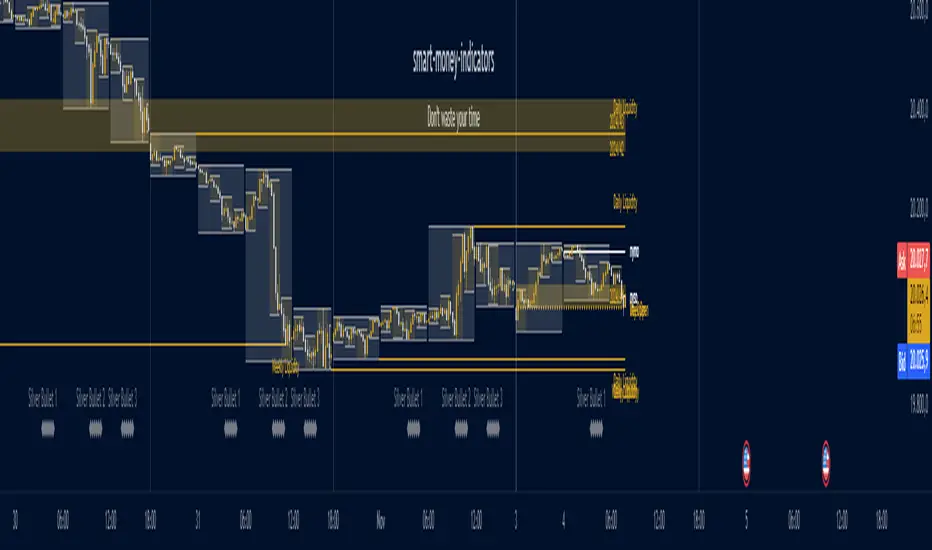
This indicator is a tool to support the "ICT" strategy.
This indicator does not provide entry or exit signals.
This indicator is a tool to mark key price areas.
This indicator is a tool to mark key time areas.
This indicator is particularly distinguished by its high customizability of tools,
setting it apart from the indicators currently available on the TradingView platform.
The following key areas are marked with the help of lines, boxes, background color, or plots:
Time Separators:
- Monthly separator
- Weekly separator
- Daily separator
Liquidity Zones:
- Daily highs/lows
- Weekly highs/lows
- Monthly highs/lows
- Asia Session (during or after the session)
- London Session (during or after the session)
- New York Session (during or after the session)
- London Close Session (during or after the session)
- Session Quarters
- Central Banks Dealer Range
Opening Prices/Average Prices:
- Weekly opening price
- New Week Open Gap
- Daily opening price
- Premium/Discount zone of the day (50% line)
- New York Midnight Open price
- New York Session Open price
Manipulation Times:
- 3 Silver Bullet times
- Macros
How can I use or interpret these areas?
Liquidity Zones:
The liquidity zones used here are time-based.
Liquidity zones can be used, depending on the reaction, either to confirm the continuation of the current trend
or as a signal for a reversal of the current trend.
Opening Prices/Average Prices:
These can be used as separators between the premium and discount zones.
If the price is below one of these values, you are in the discount zone and might look for buy signals.
If the price is above one of these values, you are in the premium zone and might look for sell signals.
僅限邀請腳本
僅作者批准的使用者才能訪問此腳本。您需要申請並獲得使用許可,通常需在付款後才能取得。更多詳情,請依照作者以下的指示操作,或直接聯絡smart-money-indicators。
TradingView不建議在未完全信任作者並了解其運作方式的情況下購買或使用腳本。您也可以在我們的社群腳本中找到免費的開源替代方案。
作者的說明
Send us a pm or join our discord (link on website)
免責聲明
這些資訊和出版物並非旨在提供,也不構成TradingView提供或認可的任何形式的財務、投資、交易或其他類型的建議或推薦。請閱讀使用條款以了解更多資訊。