OPEN-SOURCE SCRIPT
3 EMA Indicator
3 EMA Indicator Description
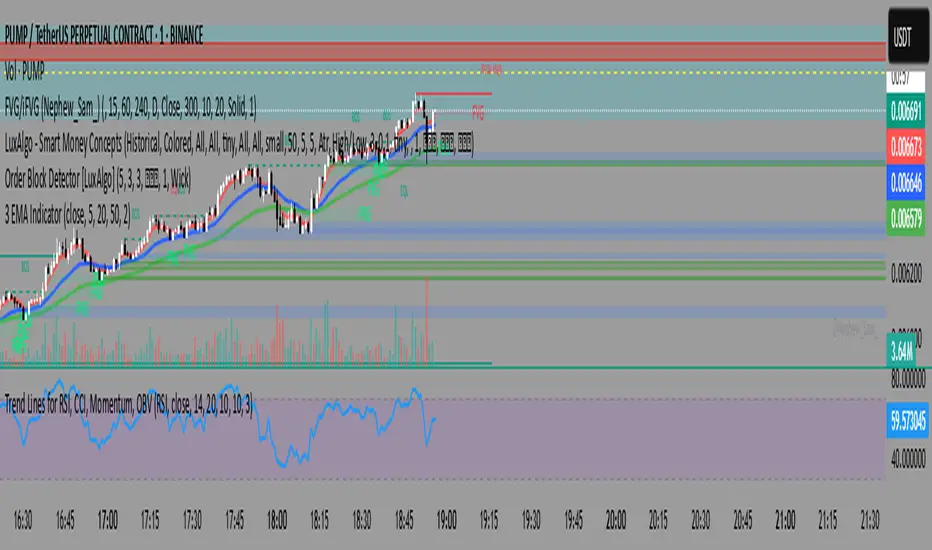
The 3 EMA Indicator is a customizable TradingView indicator designed to plot three Exponential Moving Averages (EMAs) on a price chart. It helps traders analyze trends, identify potential trading signals, and monitor price momentum through the interaction of three EMAs with user-defined periods.
Features
Three EMAs: Displays three EMAs with default periods of 9, 21, and 50, which can be adjusted via input settings.
Customizable Parameters:
Source: Choose the price data (e.g., close, open, hlc3) for EMA calculations (default: close).
EMA Periods: Set custom lengths for each EMA (minimum 1).
Colors: Assign unique colors to each EMA for clear visualization (default: red, blue, green).
Line Width: Adjust the thickness of EMA lines (default: 2).
Dynamic Label: A label on the last bar displays the configured EMA periods (e.g., "EMA1: 9, EMA2: 21, EMA3: 50") for easy reference.
Overlay: Plots directly on the price chart, making it intuitive to compare EMAs with price action.
Usage
Trend Analysis: Use the relative positions of the EMAs to identify bullish (e.g., shorter EMA above longer EMA) or bearish trends.
Crossover Signals: Monitor EMA crossovers (e.g., 9-period EMA crossing above the 21-period EMA) for potential buy or sell signals.
Customization: Adjust periods, colors, and line width through the indicator’s settings to match your trading strategy.
How to Apply
Open TradingView’s Pine Editor.
Copy and paste the indicator’s Pine Script code.
Add the indicator to your chart.
Customize settings (periods, source, colors, line width) via the indicator’s input panel.
This indicator is ideal for traders seeking a simple yet flexible tool to track price trends and momentum using multiple EMAs.
開源腳本
本著TradingView的真正精神,此腳本的創建者將其開源,以便交易者可以查看和驗證其功能。向作者致敬!雖然您可以免費使用它,但請記住,重新發佈程式碼必須遵守我們的網站規則。
免責聲明
這些資訊和出版物並不意味著也不構成TradingView提供或認可的金融、投資、交易或其他類型的意見或建議。請在使用條款閱讀更多資訊。
開源腳本
本著TradingView的真正精神,此腳本的創建者將其開源,以便交易者可以查看和驗證其功能。向作者致敬!雖然您可以免費使用它,但請記住,重新發佈程式碼必須遵守我們的網站規則。
免責聲明
這些資訊和出版物並不意味著也不構成TradingView提供或認可的金融、投資、交易或其他類型的意見或建議。請在使用條款閱讀更多資訊。