OPEN-SOURCE SCRIPT
ADX & DI trend exhaustion
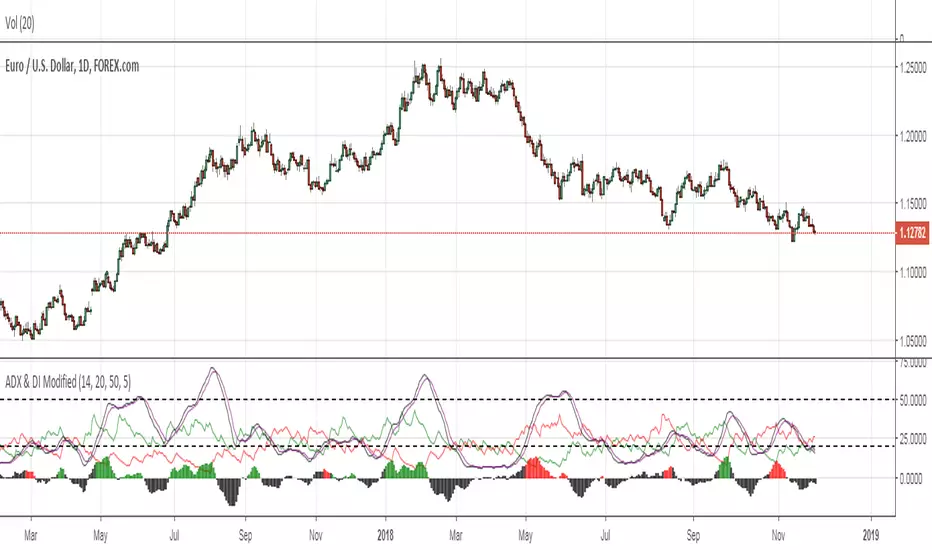
An EMA is applied to the ADX in order to catch the exhaustion of a trend (i.e. ADX line crossunder EMAADX line) or the possible formation of a new one. In the first case, we would wait a confirmation signal, which happens when the crossunder has a value greater then 50. A new trend is created when the difference between the ADX and the EMAADX is positive, with ADX greater then 20. As confirmation, we would have the DI+ greater then 20 e the DI- smaller then 20 (this would trigger a bullish sentiment, bearish for the opposite), consequently the histogram will be display in green (red in the bearish case).
開源腳本
本著TradingView的真正精神,此腳本的創建者將其開源,以便交易者可以查看和驗證其功能。向作者致敬!雖然您可以免費使用它,但請記住,重新發佈程式碼必須遵守我們的網站規則。
免責聲明
這些資訊和出版物並不意味著也不構成TradingView提供或認可的金融、投資、交易或其他類型的意見或建議。請在使用條款閱讀更多資訊。
開源腳本
本著TradingView的真正精神,此腳本的創建者將其開源,以便交易者可以查看和驗證其功能。向作者致敬!雖然您可以免費使用它,但請記住,重新發佈程式碼必須遵守我們的網站規則。
免責聲明
這些資訊和出版物並不意味著也不構成TradingView提供或認可的金融、投資、交易或其他類型的意見或建議。請在使用條款閱讀更多資訊。