PROTECTED SOURCE SCRIPT
DistributionDays_FTD_iDavinderK
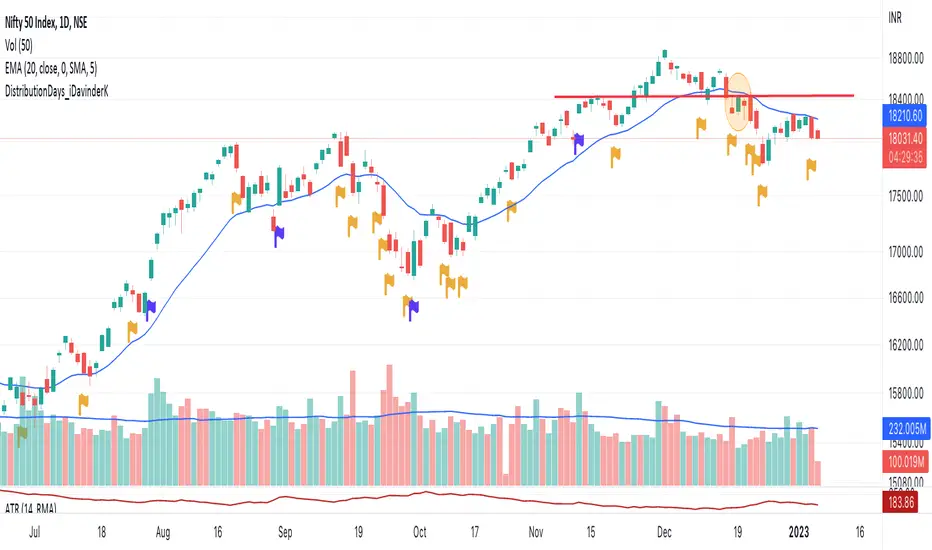
This script identifies the distribution days and follow through day.
DD count helps a trader identify a general trend of the market. A distribution day is flagged when index drops more than 0.2% and above average vols than previous day. 4 or more distribution days shows choppiness in the market and longs are unlikely to work.
A follow through day on the other hand shows strong buying emerges from the bottom. An FTD is flagged when index moves up 1.5% or more on higher vols than previous day.
Once an FTD is seen DD count goes back to zero.
DD are shown as Yellow flag here.
FTD are shown as Blue flag,
受保護腳本
此腳本以閉源形式發佈。 不過,您可以自由使用,沒有任何限制 — 點擊此處了解更多。
免責聲明
這些資訊和出版物並非旨在提供,也不構成TradingView提供或認可的任何形式的財務、投資、交易或其他類型的建議或推薦。請閱讀使用條款以了解更多資訊。
免責聲明
這些資訊和出版物並非旨在提供,也不構成TradingView提供或認可的任何形式的財務、投資、交易或其他類型的建議或推薦。請閱讀使用條款以了解更多資訊。