OPEN-SOURCE SCRIPT
High Low Yearly
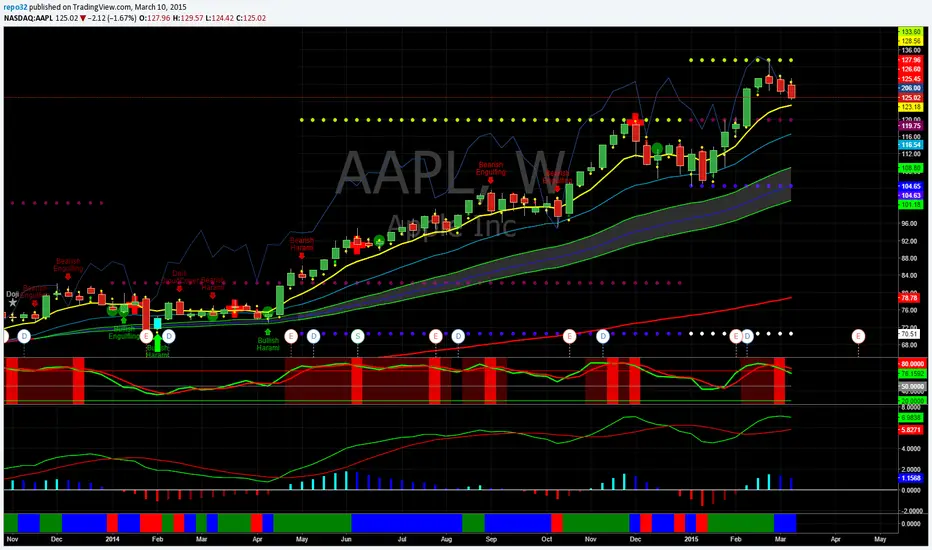
Sorry for the mess above. Not sure how to remove it. It was not what I was looking to post. I added the the clean chart below.
This was requested by "N". It displays the current yearly highs and lows along with the previous years highs and lows. Just a nice way to see the support resistance in all time frames.
This was requested by "N". It displays the current yearly highs and lows along with the previous years highs and lows. Just a nice way to see the support resistance in all time frames.
開源腳本
本著TradingView的真正精神,此腳本的創建者將其開源,以便交易者可以查看和驗證其功能。向作者致敬!雖然您可以免費使用它,但請記住,重新發佈程式碼必須遵守我們的網站規則。
免責聲明
這些資訊和出版物並不意味著也不構成TradingView提供或認可的金融、投資、交易或其他類型的意見或建議。請在使用條款閱讀更多資訊。
免責聲明
這些資訊和出版物並不意味著也不構成TradingView提供或認可的金融、投資、交易或其他類型的意見或建議。請在使用條款閱讀更多資訊。