INVITE-ONLY SCRIPT
Power Law Volatility by G. Santostasi
Introduction
This TradingView indicator is designed to provide a comprehensive analysis of Bitcoin's price movements using the concept of power laws. The indicator leverages the mathematical properties of power laws to predict returns and highlight significant deviations from expected trends. By applying the power law model to Bitcoin's price data, we aim to capture the diminishing returns over time and provide valuable insights to traders and analysts.
Theoretical Foundation
The foundation of this indicator is based on the power law, which describes a relationship between two quantities where one quantity varies as a power of another. Specifically, in the context of Bitcoin prices, we observe that returns follow a power law relationship with time.
Mathematically, if the power law holds true, the price P at time 𝑡 can be expressed as:
log(𝑃)=𝑚log(𝑡)+c where m is the slope of the power law and c is the y-intercept.
To understand the returns, we consider two points in time,
𝑡1and 𝑡2, with corresponding prices 𝑃 and 𝑃2. The returns can be derived as follows:
log(𝑃2)−log(𝑃1)=𝑚(log(𝑡2)−log(𝑡1))
This simplifies to:
log(𝑃2/𝑃1)=𝑚log(𝑡2/𝑡1)
For daily data, we let 𝑡2=𝑡1+1resulting in:
log(𝑅)=𝑚log(𝑡+1/𝑡)
where 𝑅 represents the returns, 𝑡 is the number of days from the Genesis Block, and
𝑚 is the slope of the power law.
Observations and Data Analysis
Using historical Bitcoin price data, we observe that returns decrease over time, which is indicative of diminishing returns. To validate this observation, we averaged real returns over a two-month period and compared them with the theoretical results derived from the power law:
𝑚log(𝑡2/𝑡1)
The comparison shows that the averaged real returns align closely with the theoretical predictions, reinforcing the validity of the power law model.
This alignment indicates that the power law is not merely an arbitrary straight line but a model that accurately captures the decay of returns over time. The scaling property of the power law holds at all scales, providing a robust framework for analyzing Bitcoin's price dynamics.
Indicator Components
The indicator comprises several components to visualize the power law's implications and provide actionable insights:
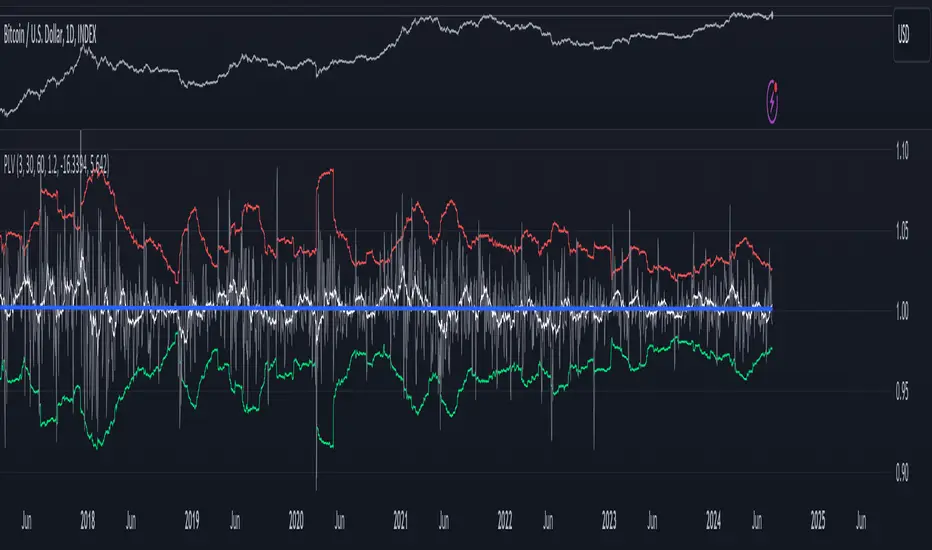
Theoretical Power Law Trend:
Plots the theoretical result from the power law model.
Shows the expected returns based on the power law relationship.
Real Returns:
Plots the real returns averaged over a user-defined Simple Moving Average (SMA) or Exponential Moving Average (EMA).
Provides a comparison between actual market performance and theoretical predictions.
When the real volatility is above the theoretical one derived from the power law the indicator identifies times when the price is overvalued.
Standard Deviations:
Calculates standard deviations on a moving window basis.
Plots deviations from the theoretical power law trend, highlighting significant discrepancies.
Color-Coded Thresholds:
Highlights points that deviate significantly from the expected trend.
Red indicates returns above the upper threshold (indicating potential overperformance or overvaluation).
Green indicates returns below the lower threshold (indicating potential underperformance or undervaluation).
Practical Usage
Traders and analysts can use this indicator to:
Identify periods where Bitcoin's returns deviate significantly from the expected power law trend.
Make informed trading decisions based on the likelihood of mean reversion to the theoretical trend.
Understand the long-term diminishing returns trend and adjust investment strategies accordingly.
Conclusion
This TradingView indicator leverages the power law to provide a detailed and theoretically grounded analysis of Bitcoin's price movements. By comparing real returns with theoretical predictions, the indicator offers valuable insights into market behavior and highlights significant deviations. The use of color-coded thresholds further enhances the utility of the indicator, making it an essential tool for traders and analysts seeking to understand and capitalize on Bitcoin's price dynamics
This TradingView indicator is designed to provide a comprehensive analysis of Bitcoin's price movements using the concept of power laws. The indicator leverages the mathematical properties of power laws to predict returns and highlight significant deviations from expected trends. By applying the power law model to Bitcoin's price data, we aim to capture the diminishing returns over time and provide valuable insights to traders and analysts.
Theoretical Foundation
The foundation of this indicator is based on the power law, which describes a relationship between two quantities where one quantity varies as a power of another. Specifically, in the context of Bitcoin prices, we observe that returns follow a power law relationship with time.
Mathematically, if the power law holds true, the price P at time 𝑡 can be expressed as:
log(𝑃)=𝑚log(𝑡)+c where m is the slope of the power law and c is the y-intercept.
To understand the returns, we consider two points in time,
𝑡1and 𝑡2, with corresponding prices 𝑃 and 𝑃2. The returns can be derived as follows:
log(𝑃2)−log(𝑃1)=𝑚(log(𝑡2)−log(𝑡1))
This simplifies to:
log(𝑃2/𝑃1)=𝑚log(𝑡2/𝑡1)
For daily data, we let 𝑡2=𝑡1+1resulting in:
log(𝑅)=𝑚log(𝑡+1/𝑡)
where 𝑅 represents the returns, 𝑡 is the number of days from the Genesis Block, and
𝑚 is the slope of the power law.
Observations and Data Analysis
Using historical Bitcoin price data, we observe that returns decrease over time, which is indicative of diminishing returns. To validate this observation, we averaged real returns over a two-month period and compared them with the theoretical results derived from the power law:
𝑚log(𝑡2/𝑡1)
The comparison shows that the averaged real returns align closely with the theoretical predictions, reinforcing the validity of the power law model.
This alignment indicates that the power law is not merely an arbitrary straight line but a model that accurately captures the decay of returns over time. The scaling property of the power law holds at all scales, providing a robust framework for analyzing Bitcoin's price dynamics.
Indicator Components
The indicator comprises several components to visualize the power law's implications and provide actionable insights:
Theoretical Power Law Trend:
Plots the theoretical result from the power law model.
Shows the expected returns based on the power law relationship.
Real Returns:
Plots the real returns averaged over a user-defined Simple Moving Average (SMA) or Exponential Moving Average (EMA).
Provides a comparison between actual market performance and theoretical predictions.
When the real volatility is above the theoretical one derived from the power law the indicator identifies times when the price is overvalued.
Standard Deviations:
Calculates standard deviations on a moving window basis.
Plots deviations from the theoretical power law trend, highlighting significant discrepancies.
Color-Coded Thresholds:
Highlights points that deviate significantly from the expected trend.
Red indicates returns above the upper threshold (indicating potential overperformance or overvaluation).
Green indicates returns below the lower threshold (indicating potential underperformance or undervaluation).
Practical Usage
Traders and analysts can use this indicator to:
Identify periods where Bitcoin's returns deviate significantly from the expected power law trend.
Make informed trading decisions based on the likelihood of mean reversion to the theoretical trend.
Understand the long-term diminishing returns trend and adjust investment strategies accordingly.
Conclusion
This TradingView indicator leverages the power law to provide a detailed and theoretically grounded analysis of Bitcoin's price movements. By comparing real returns with theoretical predictions, the indicator offers valuable insights into market behavior and highlights significant deviations. The use of color-coded thresholds further enhances the utility of the indicator, making it an essential tool for traders and analysts seeking to understand and capitalize on Bitcoin's price dynamics
僅限邀請腳本
只有經作者批准的使用者才能訪問此腳本。您需要申請並獲得使用權限。該權限通常在付款後授予。如欲了解更多詳情,請依照以下作者的說明操作,或直接聯絡Quantonomyfund。
除非您完全信任其作者並了解腳本的工作原理,否則TradingView不建議您付費或使用腳本。您也可以在我們的社群腳本中找到免費的開源替代方案。
作者的說明
To access the indicator please read instructions here:
https://bitposeidon.com/power-law-indicators
提醒:在請求訪問權限之前,請閱讀僅限邀請腳本指南。
免責聲明
這些資訊和出版物並不意味著也不構成TradingView提供或認可的金融、投資、交易或其他類型的意見或建議。請在使用條款閱讀更多資訊。