OPEN-SOURCE SCRIPT
已更新 Smart Channel
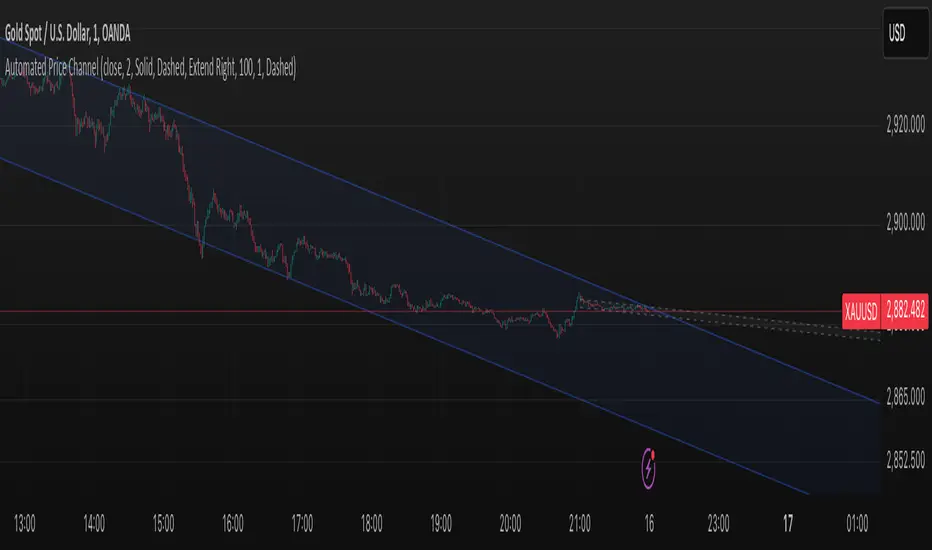
The "Smart Channel" indicator is designed to dynamically identify and plot price channels on a chart. It uses a statistical approach based on Pearson's correlation coefficient to determine the best-fit channel for both short-term and long-term trends. This allows traders to visualize potential support and resistance levels, identify trend direction, and potentially anticipate breakouts or reversals.
How it Works:
Data Input: The indicator takes a source input (typically the closing price) as the basis for its calculations.
Period Selection: It defines two sets of lookback periods: one for short-term analysis and one for long-term analysis. The code iterates through these periods, calculating a linear regression and standard deviation for each.
Pearson's Correlation: For each period, the indicator calculates Pearson's R, which measures the strength and direction of the linear relationship between price and time. A higher absolute value of Pearson's R indicates a stronger trend.
Best Fit Channel: The indicator identifies the period with the highest Pearson's R for both short-term and long-term and uses the corresponding linear regression parameters (slope and intercept) to define the midline of the channel.
Standard Deviation: The standard deviation of the price data around the regression line is calculated. This is used to define the upper and lower boundaries of the channel. The channel width is controlled by a "Deviation Multiplier" input.
Channel Plotting: The indicator plots the midline, upper boundary, and lower boundary of the channel on the chart. Separate channels are plotted for the short-term and long-term best-fit periods, using different colors for easy visual distinction.
Dynamic Updates: The channel is dynamically updated as new price data becomes available, adjusting to the evolving market trend.
Key Inputs and Settings:
Source: The price data used for calculations (e.g., close, open, high, low, etc.).
Use Long-Term Channel: A boolean input to enable/disable the calculation and plotting of the long-term channel.
Deviation Multiplier: Controls the width of the channel (how many standard deviations away from the midline the boundaries are).
Channel/Midline Colors and Transparency: Customizable colors and transparency levels for the channel lines and fill.
Line Styles: Options for solid, dotted, or dashed lines for the channel boundaries and midline.
Extend Style: How the channel lines should extend (right, both, none, left).
Interpretation and Usage:
Trend Identification: The direction of the midline indicates the prevailing trend. An upward-sloping midline suggests an uptrend, while a downward-sloping midline suggests a downtrend.
Support and Resistance: The upper and lower channel boundaries can act as potential support and resistance levels.
Breakouts: A price move outside of the channel boundaries may signal a potential breakout or reversal.
Overbought/Oversold: Prices touching or exceeding the upper boundary might suggest an overbought condition, while prices touching or exceeding the lower boundary might suggest an oversold condition.
Short-Term vs. Long-Term: Comparing the short-term and long-term channels can provide insights into the overall market context. For example, a short-term uptrend within a long-term downtrend might suggest a potential buying opportunity before the larger trend resumes.
發行說明
Update: Resolved a bug causing overlapping channel lines. The indicator now clears previous channels for accurate display.開源腳本
秉持TradingView一貫精神,這個腳本的創作者將其設為開源,以便交易者檢視並驗證其功能。向作者致敬!您可以免費使用此腳本,但請注意,重新發佈代碼需遵守我們的社群規範。
免責聲明
這些資訊和出版物並非旨在提供,也不構成TradingView提供或認可的任何形式的財務、投資、交易或其他類型的建議或推薦。請閱讀使用條款以了解更多資訊。
免責聲明
這些資訊和出版物並非旨在提供,也不構成TradingView提供或認可的任何形式的財務、投資、交易或其他類型的建議或推薦。請閱讀使用條款以了解更多資訊。