OPEN-SOURCE SCRIPT
已更新 PivotBoss Doji Reversal Setup
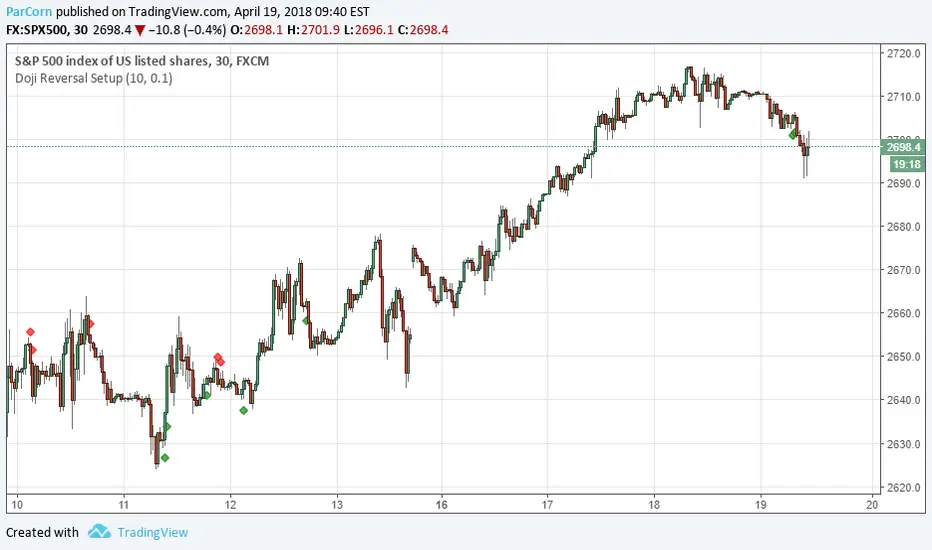
PATTERN SUMMARY
1. The open and close price of the doji should fall within 10 percent of each other, as measured by the total range
of the candlestick.
2. For a bullish doji, the high of the doji candlestick should be below the ten-period simple moving average (H <
SMA(lO)).
3. For a bearish doji, the low of the doji candlestick should be above the ten-period simple moving average (L >
SMA(lO)).
4. For a bearish doji, one of the two bars following the doji must close beneath the low of the doji (C < L[l] or C <
L[2]).
5. For a bullish doji setup, one of the two bars following the doji must close above the high of the doji (C > H[l])
or C > H[2])
PATTERN PSYCHOLOGY
The doji candlestick is the epitome of indecision. The pattern illustrates a virtual stalemate between buyers
and sellers, which means the existing trend may be on the verge of a reversal. If buyers have been controlling a
bullish advance over a period of time, you will typically see full-bodied candlesticks that personify the bullish
nature of the move. However, if a doji candlestick suddenly appears, the indication is that buyers are suddenly
not as confident in upside price potential as they once were. This is clearly a point of indecision, as buyers are no
longer pushing price to higher valuation, and have allowed sellers to battle them to a draw-at least for this one
candlestick. This leads to profit taking, as buyers begin to sell their profitable long positions, which is heightened
by responsive sellers entering the market due to perceived overvaluation. This "double whammy" of selling
pressure essentially pushes price lower, as responsive sellers take control of the market and push price back
toward fair value.
發行說明
update signal style開源腳本
秉持TradingView一貫精神,這個腳本的創作者將其設為開源,以便交易者檢視並驗證其功能。向作者致敬!您可以免費使用此腳本,但請注意,重新發佈代碼需遵守我們的社群規範。
免責聲明
這些資訊和出版物並非旨在提供,也不構成TradingView提供或認可的任何形式的財務、投資、交易或其他類型的建議或推薦。請閱讀使用條款以了解更多資訊。
免責聲明
這些資訊和出版物並非旨在提供,也不構成TradingView提供或認可的任何形式的財務、投資、交易或其他類型的建議或推薦。請閱讀使用條款以了解更多資訊。