INVITE-ONLY SCRIPT
已更新 Sonarlab - MTF Imbalance/ FVG
An imbalance is created when the order block creates such impulsive volume in the market that it throws off the equilibrium between buyers and sellers, forming a gap. This is referred to as imbalance or FVG. These gaps act as a magnet for price to retrace to, in order to correct the disturbance in market equilibrium.
Imbalances = FVG

This image above shows you how an imbalance is created in the market using 3 candles. As we all know, candle sticks represent a specific time-range - for example: 1H. This means that inside 1 candle stick, there are 60 1 minute candle sticks resting. What I'm trying to say with this is that you get a totally different picture when you are on the lower timeframes. An imbalance can be overlooked, so it can be very helpful to have the multiple timeframe Imbalances on your screen, so you understand what is actually going on in the bigger picture.

Usage
Focused on combining with SMC:
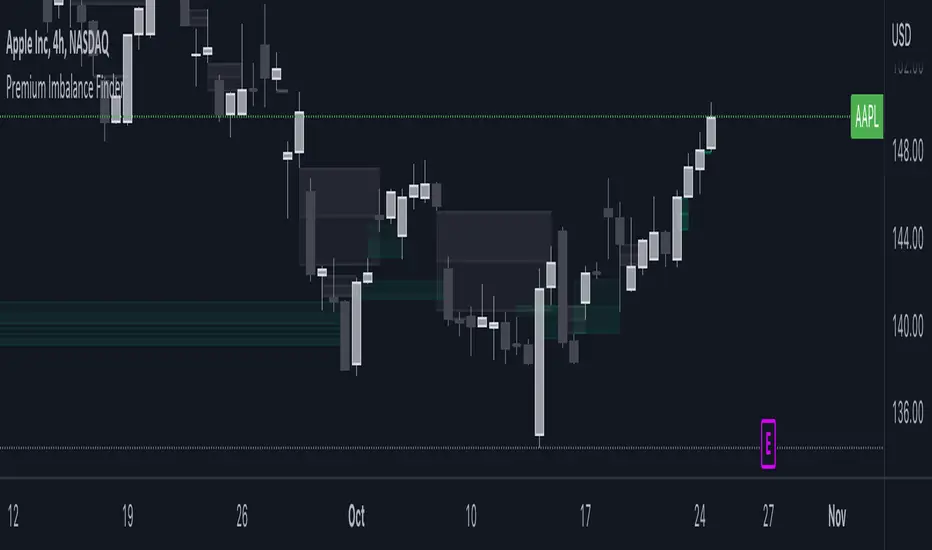
When trading SMC, Imbalances can be great for POI's (point of interests) or using as targets in the market. Imbalances work like magnets in the market. When the market is imbalanced, it mostly wants to balance those gaps and can sometimes react perfectly from the area's. Besides that, it can really give you an idea who is in control at that moment.

Here you can see an example of an Imbalance when on the 1H timeframe - in the next picture below you can see the exact same imbalance, but then on the 3M. Now you understand why it can be overlooked?

So, imbalances/ FVG's:
- Increase probability of certain Point of Interests
- Can be a sign of strong interest in price areas
- Can be used as targets
- Can be used as POI's
What makes this Imbalance indicator different?
The Sonarlab MTF Imbalance indicator makes it possible to show up to 3 higher timeframes, which makes it easier to do your analysis and spot these areas when trading.
Imbalances = FVG
This image above shows you how an imbalance is created in the market using 3 candles. As we all know, candle sticks represent a specific time-range - for example: 1H. This means that inside 1 candle stick, there are 60 1 minute candle sticks resting. What I'm trying to say with this is that you get a totally different picture when you are on the lower timeframes. An imbalance can be overlooked, so it can be very helpful to have the multiple timeframe Imbalances on your screen, so you understand what is actually going on in the bigger picture.
Usage
Focused on combining with SMC:
When trading SMC, Imbalances can be great for POI's (point of interests) or using as targets in the market. Imbalances work like magnets in the market. When the market is imbalanced, it mostly wants to balance those gaps and can sometimes react perfectly from the area's. Besides that, it can really give you an idea who is in control at that moment.
Here you can see an example of an Imbalance when on the 1H timeframe - in the next picture below you can see the exact same imbalance, but then on the 3M. Now you understand why it can be overlooked?
So, imbalances/ FVG's:
- Increase probability of certain Point of Interests
- Can be a sign of strong interest in price areas
- Can be used as targets
- Can be used as POI's
What makes this Imbalance indicator different?
The Sonarlab MTF Imbalance indicator makes it possible to show up to 3 higher timeframes, which makes it easier to do your analysis and spot these areas when trading.
發行說明
Premium Imbalance Finder v1.0.1- Added Volume and Gap Imbalances, in addition to the Fair Value Gap
- Added option to set the mitigation level
發行說明
- Imbalances now update and re-size with live price action- Minor changes and bug fixes
發行說明
- Fixed Bearish Imbalance not extending發行說明
- Fixed issue with "remove mitigated" setting發行說明
New update- Added Balanced Price Range (BPR)
- Fixed Volume Imbalance bug
- Minor changes
僅限邀請腳本
只有經作者批准的使用者才能訪問此腳本。您需要申請並獲得使用權限。該權限通常在付款後授予。如欲了解更多詳情,請依照以下作者的說明操作,或直接聯絡vuetratrading。
除非您完全信任其作者並了解腳本的工作原理,否則TradingView不建議您付費或使用腳本。您也可以在我們的社群腳本中找到免費的開源替代方案。
作者的說明
Please send us a private message
免責聲明
這些資訊和出版物並不意味著也不構成TradingView提供或認可的金融、投資、交易或其他類型的意見或建議。請在使用條款閱讀更多資訊。
僅限邀請腳本
只有經作者批准的使用者才能訪問此腳本。您需要申請並獲得使用權限。該權限通常在付款後授予。如欲了解更多詳情,請依照以下作者的說明操作,或直接聯絡vuetratrading。
除非您完全信任其作者並了解腳本的工作原理,否則TradingView不建議您付費或使用腳本。您也可以在我們的社群腳本中找到免費的開源替代方案。
作者的說明
Please send us a private message
免責聲明
這些資訊和出版物並不意味著也不構成TradingView提供或認可的金融、投資、交易或其他類型的意見或建議。請在使用條款閱讀更多資訊。