PROTECTED SOURCE SCRIPT
Swing Support and Resistance with Breakout Alerts
Overview
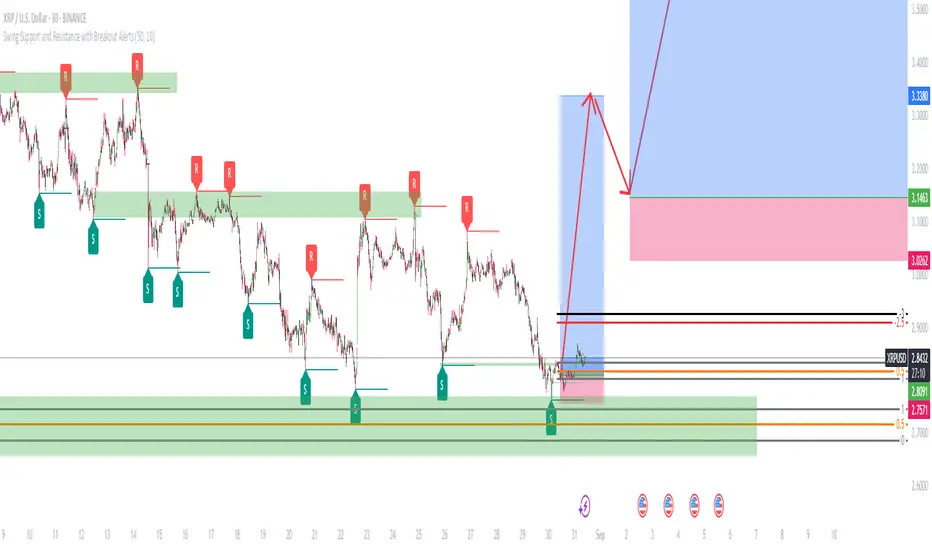
The indicator is a custom Pine Script tool designed for TradingView that automatically identifies and plots Swing Highs (Resistance) and Swing Lows (Support). It dynamically draws horizontal lines at these key price reversal points, extending them forward until they are broken, which provides traders with visual, data-driven support and resistance levels. The indicator also includes customizable alerts to notify users when a breakout occurs.
Key features
Dynamic Swing Detection: The indicator automatically detects significant swing high and low points based on a user-adjustable "Swing Detection Length" parameter. This allows traders to fine-tune the sensitivity, focusing on either short-term swings or major market turning points. Swing Length Adjustable.
Adaptive Support and Resistance Zones: The script plots horizontal lines at the detected swing levels. These lines dynamically extend forward in time, acting as predictive support and resistance zones until the price convincingly breaks through them.
Historical Context: Once a support or resistance level is broken, the indicator can optionally keep the line on the chart but changes its appearance (e.g., to a dashed line). This allows traders to see how previous levels have held or been violated, as broken resistance often becomes new support and vice versa.
Customizable Breakout Alerts: A key feature is the ability to generate alerts. When the price closes above a recent resistance line or below a recent support line, a notification is triggered. This helps traders monitor potential breakouts in real-time.
Visual Clarity: Users can customize the colors and styles of the lines and labels to suit their preferences, making it easier to distinguish between different levels and maintain a clean chart.
How to use
This indicator is a powerful tool for technical analysis and can be used in several ways:
Identify Market Structure: It provides a clear, visual representation of a market's recent structure and key reversal points.
Develop Trading Strategies: It can form the basis of a breakout strategy by using the alert function to identify when a key level is broken.
Set Stop-Loss and Take-Profit Levels: The swing highs and lows act as natural reference points for placing stop-loss orders and potential profit targets.
Confirm Trend Reversals: A failure to make a new swing high or low while the price moves in that direction can be a sign of a weakening trend and a potential reversal.
Always use proper risk management and stop-loss orders to protect your capital in case the market moves against your trade.
Keep in mind that the provided indicator is a simple example based on the Swing Highs (Resistance) and Swing Lows (Support) concepts and should not be considered financial advice.
Traders often combine multiple concepts to develop their trading strategies. The provided indicator should be treated as a starting point to explore and implement in your trading strategy.
受保護腳本
此腳本以閉源形式發佈。 不過,您可以自由使用,沒有任何限制 — 點擊此處了解更多。
免責聲明
這些資訊和出版物並非旨在提供,也不構成TradingView提供或認可的任何形式的財務、投資、交易或其他類型的建議或推薦。請閱讀使用條款以了解更多資訊。
受保護腳本
此腳本以閉源形式發佈。 不過,您可以自由使用,沒有任何限制 — 點擊此處了解更多。
免責聲明
這些資訊和出版物並非旨在提供,也不構成TradingView提供或認可的任何形式的財務、投資、交易或其他類型的建議或推薦。請閱讀使用條款以了解更多資訊。