OPEN-SOURCE SCRIPT
已更新 even_better_sinewave_mod
Description:
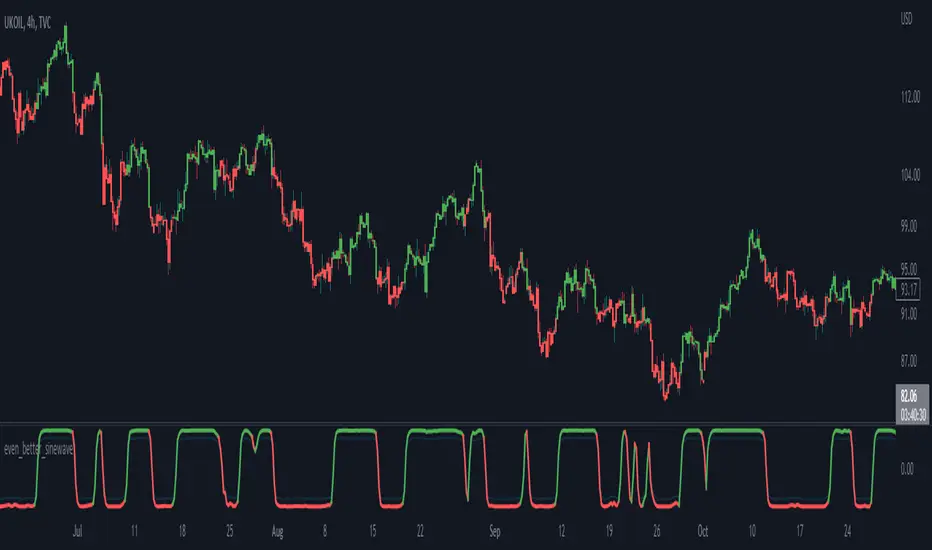
Even better sinewave was an indicator developed by John F. Ehlers (see Cycle Analytics for Trader, pg. 159), in which improvement to cycle measurements completely relies on strong normalization of the waveform. The indicator aims to create an artificially predictive indicator by transferring the cyclic data swings into a sine wave. In this indicator, the modified is on the weighted moving average as a smoothing function, instead of using the super smoother, aim to be more adaptive, and the default length is set to 55 bars.
Sinewave
smoothing = (7*hp + 6*hp_1 + 5*hp_2+ 4*hp_3 + 3*hp_4 + 2*hp5 + hp_6) /28
normalize = wave/sqrt(power)
Notes:
- sinewave indicator crossing over -0.9 is considered to beginning of the cycle while crossing under 0.9 is considered as an end of the cycle
- line color turns to green considered as a confirmation of an uptrend, while turns red as a confirmation of a downtrend
- confidence of using indicator will be much in confirmation paired with another indicator such dynamic trendline e.g. moving average
- as cited within Ehlers book Cycle Analytic for Traders, the indicator will be useful if the satisfied market cycle mode and the period of the dominant cycle must be estimated with reasonable accuracy
Other Example
發行說明
adjusting the high-pass filter, and re-arrange the color condition發行說明
update plot, adding create an alert and barcolor options開源腳本
秉持TradingView一貫精神,這個腳本的創作者將其設為開源,以便交易者檢視並驗證其功能。向作者致敬!您可以免費使用此腳本,但請注意,重新發佈代碼需遵守我們的社群規範。
免責聲明
這些資訊和出版物並非旨在提供,也不構成TradingView提供或認可的任何形式的財務、投資、交易或其他類型的建議或推薦。請閱讀使用條款以了解更多資訊。
開源腳本
秉持TradingView一貫精神,這個腳本的創作者將其設為開源,以便交易者檢視並驗證其功能。向作者致敬!您可以免費使用此腳本,但請注意,重新發佈代碼需遵守我們的社群規範。
免責聲明
這些資訊和出版物並非旨在提供,也不構成TradingView提供或認可的任何形式的財務、投資、交易或其他類型的建議或推薦。請閱讀使用條款以了解更多資訊。