PROTECTED SOURCE SCRIPT
已更新 RS GEE Candle Highlighter (vs SPY/QQQ) • 5m
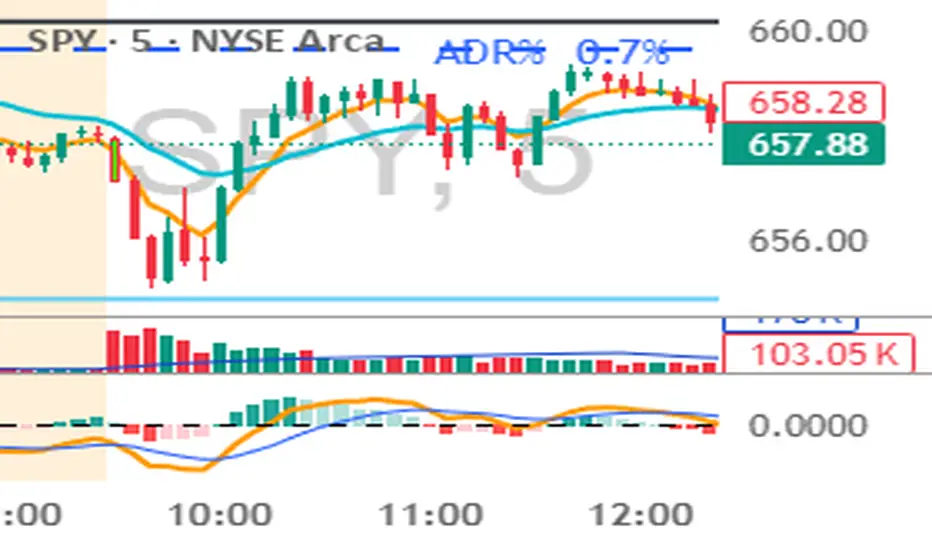
RS Candle Highlighter (vs SPY/QQQ) – 5m
This indicator highlights candles where a stock shows relative strength outperforming a benchmark index (SPY or QQQ).
Strong candles are colored.
Works in real time on the 5-minute chart.
Helps identify stocks that are outperforming the market.
👉 Ideal for day trading, scalping, and relative performance analysis.
發行說明
RS GEE Candle Highlighter (vs SPY/QQQ) – 5mThis indicator highlights candles where a stock shows relative strength outperforming a benchmark index (SPY or QQQ).
Strong candles are colored #74b3fe.
Works in real time on the 5-minute chart.
Helps identify stocks that are outperforming the market.
👉 Ideal for day trading, scalping, and relative performance analysis.
發行說明
RS Candle Highlighter (vs SPY/QQQ) – 5mThis indicator highlights candles of a stock that show relative strength vs. a benchmark index (SPY or QQQ) on a 5-minute chart.
It works in two steps:
Bar relative strength – compares the return of the current candle with the return of the benchmark over the same 5-minute period.
Cumulative relative strength – compares the stock’s performance over a rolling lookback window (user-defined, e.g. last 3–5 bars) with the benchmark’s cumulative return.
A candle is highlighted when both conditions are positive, meaning the stock is outperforming the index both on the current bar and across the recent window.
Features
Choice of benchmark: SPY or QQQ
Adjustable lookback window (number of bars for cumulative RS)
Adjustable outperformance margins for bar and cumulative signals
Colored candles (body or full candle) for clear visual detection
Optional labels (RS+) under candles
Built-in alert conditions for strong relative strength vs. SPY or QQQ
Use case
Quickly identify stocks showing early and exceptional strength versus the market or sector benchmark.
Especially useful during the first 15–30 minutes after the open, to spot leaders of the day.
🔑 Critical parameters to adjust
1. Cumulative window (lookbackBars)
If you want to detect very early, you need a short horizon.
Recommendation: 3 to 5 bars (i.e. 15–25 minutes).
👉 This lets you immediately see if a stock is outperforming right from the open, without waiting too long.
2. Outperformance margin – per bar (barEdgeBuffer)
You want to filter out microstructural noise.
On 5-minute charts, a liquid stock usually moves about ±0.05% naturally.
Recommendation: 0.001 (0.10%) to 0.002 (0.20%), depending on your tolerance.
👉 Below 0.05% it triggers too often; above 0.20% you risk missing the fast movers.
3. Outperformance margin – cumulative (cumEdgeBuffer)
To confirm that it’s not just a “one-off spike.”
Recommendation: 0.003 (0.30%) to 0.005 (0.50%).
👉 This way, after 3–5 bars, the stock has really accumulated strength versus the index.
受保護腳本
此腳本以閉源形式發佈。 不過,您可以自由使用,沒有任何限制 — 點擊此處了解更多。
免責聲明
這些資訊和出版物並非旨在提供,也不構成TradingView提供或認可的任何形式的財務、投資、交易或其他類型的建議或推薦。請閱讀使用條款以了解更多資訊。
免責聲明
這些資訊和出版物並非旨在提供,也不構成TradingView提供或認可的任何形式的財務、投資、交易或其他類型的建議或推薦。請閱讀使用條款以了解更多資訊。