INVITE-ONLY SCRIPT
Gambit Stoch RSI Grid v1.5
Gambit StochRSI Grid v1.5
This indicator was designed to be used with the Gambit Trading Suite, but may also be used as a standalone indicator.
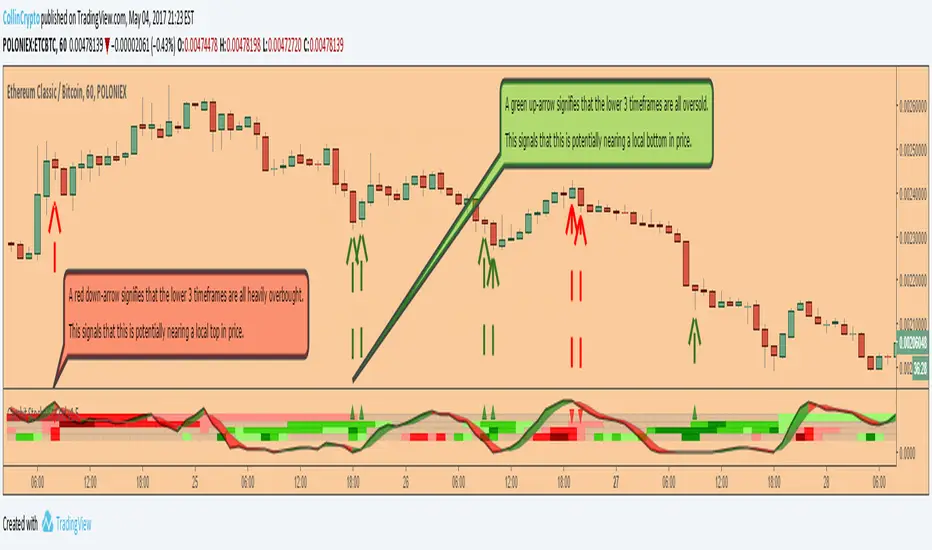
This indicator highlights StochRSI overbought/oversold values for 1D, 2H, 1H, & 30m timeframes (From top to bottom. Timeframes can be changed in settings).
If the lower three timeframes are all overbought/oversold, a direction arrow will show, suggesting the direction of the trend. By default, there are four available timeframes tracked, three of which are low timeframe and one is for a quick-glance at the 1D. Only the lower three are utilized for printing arrow signals. These arrows can be disabled in the config.
Lighter coloured arrows show the same signal, but a weaker version. These are disabled by default but may be turned on for early warnings.
Try this indicator for FREE! Leave a comment below and we will give you access to the trading suite generally within 24 hours.
This indicator was designed to be used with the Gambit Trading Suite, but may also be used as a standalone indicator.
This indicator highlights StochRSI overbought/oversold values for 1D, 2H, 1H, & 30m timeframes (From top to bottom. Timeframes can be changed in settings).
If the lower three timeframes are all overbought/oversold, a direction arrow will show, suggesting the direction of the trend. By default, there are four available timeframes tracked, three of which are low timeframe and one is for a quick-glance at the 1D. Only the lower three are utilized for printing arrow signals. These arrows can be disabled in the config.
Lighter coloured arrows show the same signal, but a weaker version. These are disabled by default but may be turned on for early warnings.
Try this indicator for FREE! Leave a comment below and we will give you access to the trading suite generally within 24 hours.
僅限邀請腳本
僅作者批准的使用者才能訪問此腳本。您需要申請並獲得使用許可,通常需在付款後才能取得。更多詳情,請依照作者以下的指示操作,或直接聯絡CollinCrypto。
TradingView不建議在未完全信任作者並了解其運作方式的情況下購買或使用腳本。您也可以在我們的社群腳本中找到免費的開源替代方案。
作者的說明
Telegram/Twitter: @CollinCrypto
免責聲明
這些資訊和出版物並非旨在提供,也不構成TradingView提供或認可的任何形式的財務、投資、交易或其他類型的建議或推薦。請閱讀使用條款以了解更多資訊。
僅限邀請腳本
僅作者批准的使用者才能訪問此腳本。您需要申請並獲得使用許可,通常需在付款後才能取得。更多詳情,請依照作者以下的指示操作,或直接聯絡CollinCrypto。
TradingView不建議在未完全信任作者並了解其運作方式的情況下購買或使用腳本。您也可以在我們的社群腳本中找到免費的開源替代方案。
作者的說明
Telegram/Twitter: @CollinCrypto
免責聲明
這些資訊和出版物並非旨在提供,也不構成TradingView提供或認可的任何形式的財務、投資、交易或其他類型的建議或推薦。請閱讀使用條款以了解更多資訊。