INVITE-ONLY SCRIPT
已更新 LIZ-ATR-Based EMA Envelopes
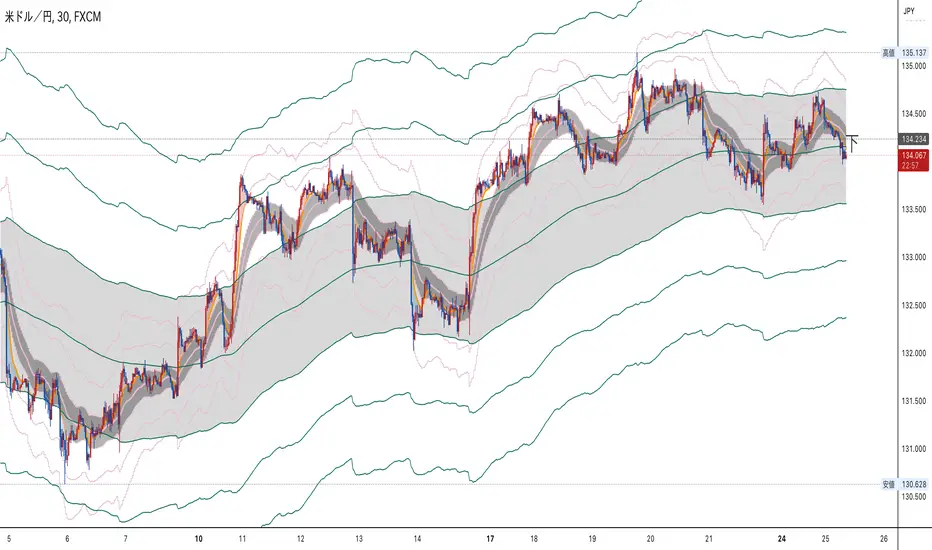
This envelope has an "auto band adjustment function" that reflects the most recent volatility in the band width by ATR.
This makes it easy to handle without the need to change the band width according to the volatility of the stocks to be displayed.
The time periods and colors of each time frame that can be displayed and the central band of the envelope are as follows.
Monthly: 2-year line (light blue)
Weekly: 3-month line (black)
Daily: 1 month line (blue)
4-hourly: 1-week line (green)
1 hour: 24 hour line (purple)
30-minute: 12-hour line (light purple)
15-minute: 4-hour line (orange)
5min:2hr (skin color)
1 minute: 30 minute line (gray-blue)
30 seconds: 10 minute line (blue-purple)
15-seconds: 7.5-minute line (sky blue)
10-seconds: 5-minute line (brown)
5-seconds: 2-minute line (emerald green)
Depending on where the price resides in the band, the following situations can be identified
・When inside the first band: Trendless
・Between the first and second band: Normal trend
・Between the 2nd and 3rd band: Strong trend
・When the third line is exceeded: Overheat condition
The first range is painted in gray and encourages not to follow the trend. In addition, the "up" sign will automatically light up when the price is above this gray zone, the "middle" sign when the price is in the middle of the gray zone, and the "down" sign when the price is below the gray zone.
このエンベロープは直近のボラティリティーをATRによってバンド幅に反映させる、「オートバンド調整機能」を搭載しています。
そのため、表示させる銘柄のボラティリティーに合わせてバンド幅を変更する必要がなく扱いやすいです。
表示できる各時間足と、エンベロープの中心バンドの期間・色は、以下の通りです。
月足:2年線(水色)
週足:3ヶ月線(黒)
日足:1ヶ月線(青)
4時間足:1週間線(緑)
1時間足:24時間線(紫)
30分足:12時間線(薄紫)
15分足:4時間線(オレンジ)
5分足:2時間線(肌色)
1分足:30分線(グレーブルー)
30秒足:10分線(青紫)
15秒足:7.5分線(スカイブルー)
10秒足:5分線(茶色)
5秒足:2分線(エメラルドグリーン)
価格がバンドのどこに存在するかによって以下の状況がわかります。
・1本目のバンド内側にある時:トレンドレス
・1本目から2本目の間にある時:ノーマルトレンド
・2本目から3本目の間にある時:強いトレンド
・3本目をオーバーしている時:過熱状態
1本目の範囲はグレーで塗られ、トレンドフォローしない事を促します。また、このグレーゾーンの上に価格がある時は「上」、中にある時は「中」、下にあるときは「下」の文字サインが自動点灯します。
發行說明
Corrected ATR period settings.Adjusted default line thickness.
ATRの期間設定を修正しました。
デフォルトの線の太さを調整しました。
發行說明
The name of the indicator has been changed.インジケーターの名前を変更しました。
發行說明
・The central band of the monthly chart was changed to the 1-year moving average.・The position and size of text information has been changed for better visibility.
・月足の中心バンドを1年移動平均線に変更しました。
・文字情報の位置と大きさを見やすいよう変更しました。
發行說明
The mid-term envelope is now displayed中期エンベロープが表示されるようになりました
發行說明
Name changed.名前を変更しました。
發行說明
Changed the content in the settings screen.設定画面内の内容を変更しました
發行說明
Line type was changed.線の種類を変更しました。
1人で悩まず、LINE公式登録
(インジ他無料プレゼント増量)
line.me/ti/p/@211ywenv
ユーチューバー対談
youtube.com/playlist?list=PL2sT2s7dIWWVYNuPLepsNNRRVCjQCqPUV
無料で学べるトレーダーズクラブ
liz-asset-design.com/
TicTokで時短動画配信中
tiktok.com/@akihikokowata
(インジ他無料プレゼント増量)
line.me/ti/p/@211ywenv
ユーチューバー対談
youtube.com/playlist?list=PL2sT2s7dIWWVYNuPLepsNNRRVCjQCqPUV
無料で学べるトレーダーズクラブ
liz-asset-design.com/
TicTokで時短動画配信中
tiktok.com/@akihikokowata
免責聲明
這些資訊和出版物並不意味著也不構成TradingView提供或認可的金融、投資、交易或其他類型的意見或建議。請在使用條款閱讀更多資訊。