INVITE-ONLY SCRIPT
已更新 EMA - Baby Whale
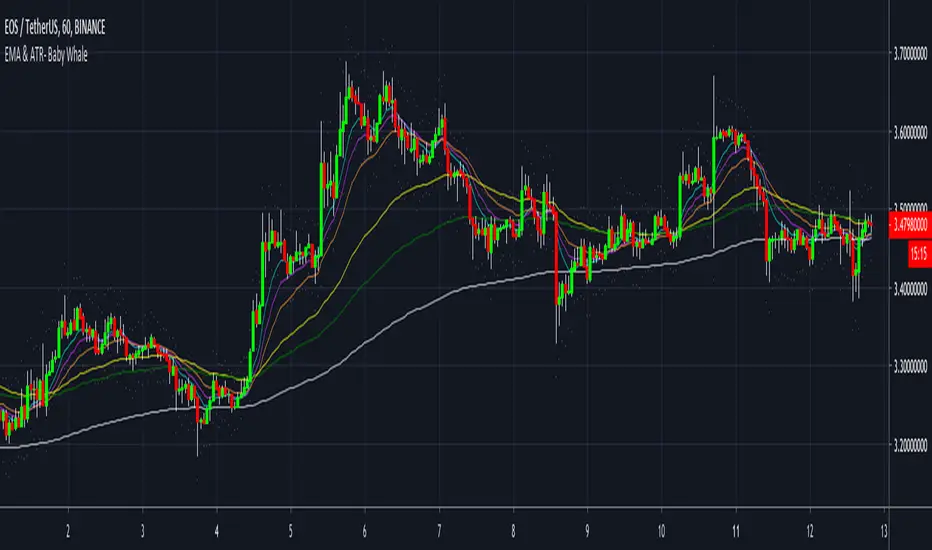
This script will give you the 8, 13, 21, 55 and 200 EMA.
I carefully picked the colors so the EMA's are visible, but not irritating.
You can change the colors yourself if you want.
You can use the EMA to define the trend.
A good strategy that traders use is a 55 EMA crossover.
This means that when the 8, 13 and 21 all cross the 55 EMA you place a buy or sell order.
You close your position when the same thing happens on the other side.
Another great way that traders use these EMA's is to spot a Golden or Death cross.
When the 55 and 200 EMA cross and the 200 becomes support it means we're in a uptrend and vice versa.
If you want access, just send a message please.
Much love from Baby Whale!!
🙏❤️🐳
發行說明
I added the 100 EMA as well.Works well on the 5m chart.
Good luck!!
發行說明
Added 24 period ATR to the script僅限邀請腳本
只有經作者批准的使用者才能訪問此腳本。您需要申請並獲得使用權限。該權限通常在付款後授予。如欲了解更多詳情,請依照以下作者的說明操作,或直接聯絡BabyWhale83。
除非您完全信任其作者並了解腳本的工作原理,否則TradingView不建議您付費或使用腳本。您也可以在我們的社群腳本中找到免費的開源替代方案。
作者的說明
免責聲明
這些資訊和出版物並不意味著也不構成TradingView提供或認可的金融、投資、交易或其他類型的意見或建議。請在使用條款閱讀更多資訊。
僅限邀請腳本
只有經作者批准的使用者才能訪問此腳本。您需要申請並獲得使用權限。該權限通常在付款後授予。如欲了解更多詳情,請依照以下作者的說明操作,或直接聯絡BabyWhale83。
除非您完全信任其作者並了解腳本的工作原理,否則TradingView不建議您付費或使用腳本。您也可以在我們的社群腳本中找到免費的開源替代方案。
作者的說明
免責聲明
這些資訊和出版物並不意味著也不構成TradingView提供或認可的金融、投資、交易或其他類型的意見或建議。請在使用條款閱讀更多資訊。