PROTECTED SOURCE SCRIPT
Machine Learning RSI with Matrix
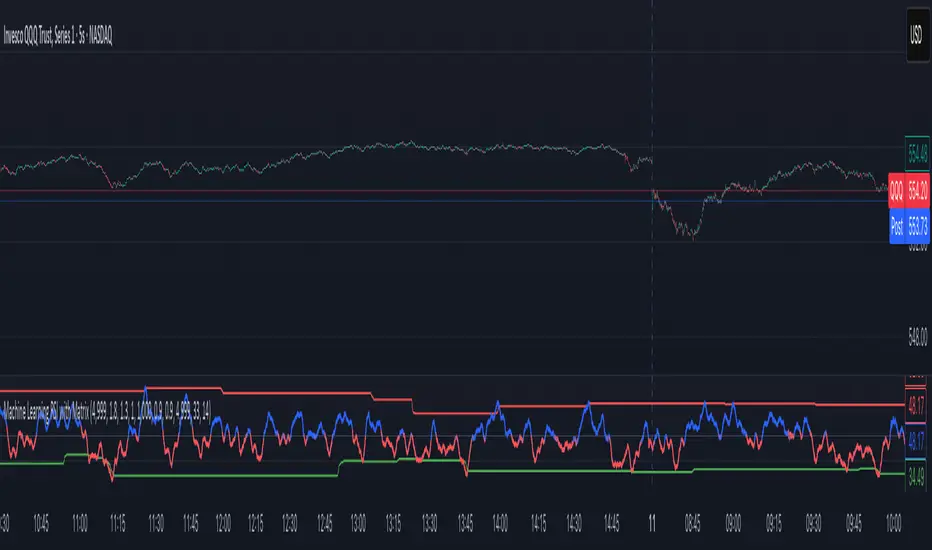
The "Machine Learning RSI with Matrix," is an adaptive version of the traditional Relative Strength Index (RSI). It's designed to dynamically adjust to changing market conditions by learning from past price action. Instead of using a fixed calculation, it employs machine learning concepts to create a more responsive and nuanced momentum oscillator.
Core Concepts
At its heart, the indicator analyzes market characteristics like momentum and volatility over a long lookback period. It uses this information to:
Cluster Market Regimes: It categorizes the market's volatility into different states or "clusters." This allows the indicator to behave differently in calm, normal, or highly volatile environments.
Store Patterns: A unique "matrix" system stores recent RSI patterns corresponding to each volatility cluster. This creates a memory of what has happened before in similar market conditions, helping it anticipate future behavior.
Generate Probabilistic Signals: It runs thousands of Monte Carlo simulations on each bar. These simulations use weighted random probabilities based on current momentum and volatility to generate a forward-looking, probabilistic signal.
Dynamic and Adaptive Features
This isn't a static tool. Its key strength lies in its ability to adapt in real-time:
Self-Adjusting RSI Length: The indicator continuously compares its predicted RSI value to a more traditional RSI calculation. The "error" between these two is then used to dynamically adjust the RSI calculation length, making it shorter for faster response in volatile markets and longer for smoother signals in trending markets.
Adaptive Learning Rate: The speed at which the indicator adapts can be set to automatically adjust based on market volatility, allowing it to learn faster when the market is moving quickly.
Recursive Memory: The final output includes a "memory" component, which is a feedback loop from its own recent values. This helps create a smoother, more stable signal that is less prone to sudden spikes.
Final Output and Visualization
The final plotted value is a sophisticated blend of multiple elements: the adaptive RSI, the true RSI, the cluster average, and the memory average. This combined signal provides a comprehensive view of momentum.
Dynamic Thresholds: The overbought and oversold levels are not fixed at 70 and 30. They move up and down based on a Z-Score of the price, which measures how extreme the current price is relative to its recent history. This helps avoid premature signals in strong trends.
受保護腳本
此腳本以閉源形式發佈。 不過,您可以自由使用,沒有任何限制 — 點擊此處了解更多。
免責聲明
這些資訊和出版物並非旨在提供,也不構成TradingView提供或認可的任何形式的財務、投資、交易或其他類型的建議或推薦。請閱讀使用條款以了解更多資訊。
免責聲明
這些資訊和出版物並非旨在提供,也不構成TradingView提供或認可的任何形式的財務、投資、交易或其他類型的建議或推薦。請閱讀使用條款以了解更多資訊。