INVITE-ONLY SCRIPT
已更新 Candles Preview MTF
Description:
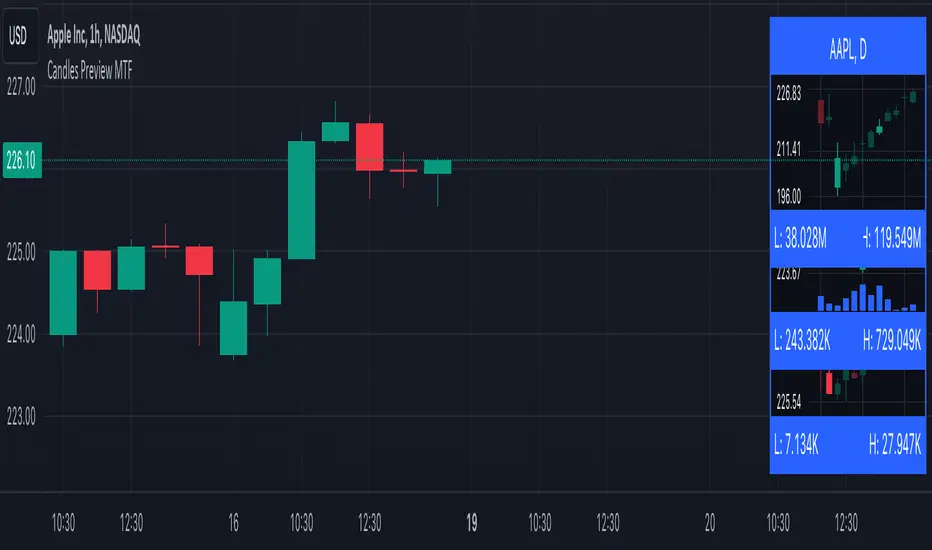
The script displays a mini-chart with candlesticks from different symbols and timeframes (up to 8 in total). It can display up to 24 candles. You can use it on any timeframe, but it is intended to work with the same or higher timeframes than the chart's. For example: you can add a mini-chart displaying candles of the chart's symbol from Weekly timeframe, while being on Daily timeframe. The script updates in realtime, but it is not recommended to use it on very low timeframes (1 second for example).
Below you can find some examples of using the indicator:
https://www.tradingview.com/x/2XKBLERi/
(custom colors, highest and lowest volume in footer, symbol name with exchange in header)

(a chart with Weekly and a chart with Monthly candles, custom colors, no footer, timeframe in header)

(charts for 5 different stocks, no footer, symbol name in header)
Along with the chart it displays a header with Symbol and Timeframe, as well as footer with highest and lowest Price or Volume for selected number of candles. Each candle displays a tooltip with the following information when hovered:
- Date / Time
- Open, High, Low and Close prices
- Price change (absolute and %)
- Volume
- Volume change (absolute and %)
By default the interface changes colors if you switch to / from "Dark mode", but you can also manually customise any colors to your likings. You can also hide both header and footer, customise what information is displayed in them, show / hide the chart's grid and change its "density", choose position and height for each of the 8 charts. Additionally, you can change the timezone used to calculate time and date.
Inputs:
The indicator's inputs are separated into groups:
- Other (contains the "Timezone" parameter)
- Chart 1 (contains parameters specific for each chart)
- Chart 2
- Chart N
- ...
- Charts (contains parameters that modify all the 8 charts)
- Colors (contains parameters for styling)
How to get it:
Contact me on Tradingview using private chat, and I will grant you a 3 day trial access
On a side note:
You can share your feedback or ideas in the comments, it will help me improve the indicator. Refer to "Release notes" section for any future updates. Thank you!
The script displays a mini-chart with candlesticks from different symbols and timeframes (up to 8 in total). It can display up to 24 candles. You can use it on any timeframe, but it is intended to work with the same or higher timeframes than the chart's. For example: you can add a mini-chart displaying candles of the chart's symbol from Weekly timeframe, while being on Daily timeframe. The script updates in realtime, but it is not recommended to use it on very low timeframes (1 second for example).
Below you can find some examples of using the indicator:
https://www.tradingview.com/x/2XKBLERi/
(custom colors, highest and lowest volume in footer, symbol name with exchange in header)
(a chart with Weekly and a chart with Monthly candles, custom colors, no footer, timeframe in header)
(charts for 5 different stocks, no footer, symbol name in header)
Along with the chart it displays a header with Symbol and Timeframe, as well as footer with highest and lowest Price or Volume for selected number of candles. Each candle displays a tooltip with the following information when hovered:
- Date / Time
- Open, High, Low and Close prices
- Price change (absolute and %)
- Volume
- Volume change (absolute and %)
By default the interface changes colors if you switch to / from "Dark mode", but you can also manually customise any colors to your likings. You can also hide both header and footer, customise what information is displayed in them, show / hide the chart's grid and change its "density", choose position and height for each of the 8 charts. Additionally, you can change the timezone used to calculate time and date.
Inputs:
The indicator's inputs are separated into groups:
- Other (contains the "Timezone" parameter)
- Chart 1 (contains parameters specific for each chart)
- Chart 2
- Chart N
- ...
- Charts (contains parameters that modify all the 8 charts)
- Colors (contains parameters for styling)
How to get it:
Contact me on Tradingview using private chat, and I will grant you a 3 day trial access
On a side note:
You can share your feedback or ideas in the comments, it will help me improve the indicator. Refer to "Release notes" section for any future updates. Thank you!
發行說明
Release notes:17 Aug 2024:
- added support for lower timeframes (including second-based)
- number of charts lowered to 3
- added price scale
- added volume chart
- candle highlighting based on Lowest / Highest price, volume, Rising / Falling volume
- added options to customise candle size, spacing, etc.
僅限邀請腳本
只有經作者批准的使用者才能訪問此腳本。您需要申請並獲得使用權限。該權限通常在付款後授予。如欲了解更多詳情,請依照以下作者的說明操作,或直接聯絡sabricat。
除非您完全信任其作者並了解腳本的工作原理,否則TradingView不建議您付費或使用腳本。您也可以在我們的社群腳本中找到免費的開源替代方案。
作者的說明
Ping me using private chat and I will grant you a 3 day trial access. If after that period you wanna continue using the script, please contact me again for further instructions.
提醒:在請求訪問權限之前,請閱讀僅限邀請腳本指南。
免責聲明
這些資訊和出版物並不意味著也不構成TradingView提供或認可的金融、投資、交易或其他類型的意見或建議。請在使用條款閱讀更多資訊。