OPEN-SOURCE SCRIPT
已更新 Interval Vertical Line Drawer
Introduction
The Interval Vertical Line Drawer is an indicator that assists traders in visualizing specific intervals on the chart. This script enables traders to conduct more accurate analyses across various time frames.
How It Works
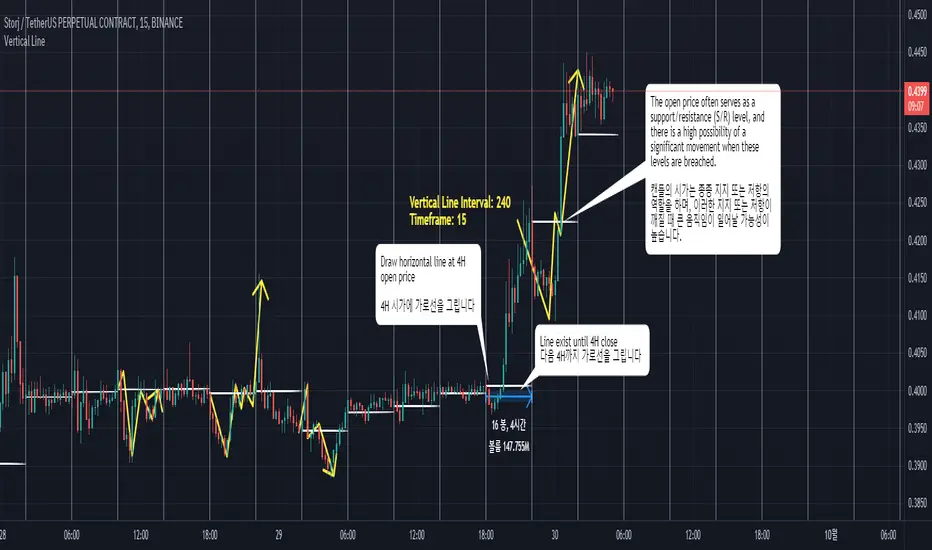
This script operates by drawing vertical lines at intervals defined by the user. Users can select the interval for the vertical lines in minutes, and the script automatically places vertical lines at each interval on the chart. For instance, if a 15-minute interval is selected, vertical lines will appear at the start and end times of every 15-minute candle on the chart.
Additionally, this script includes a feature that allows drawing horizontal lines representing the open price of the candles at each vertical line. This is crucial for traders observing price action around specific times and evaluating market conditions at regular intervals.
This script is operative across diverse time frames and can be adjusted to fit various trading styles and analyses. It is efficient, user-friendly, and adaptable to the diverse needs of traders.
The open price of a candle often serves as a support or resistance, and there is a high possibility of significant movement occurring when these S/R levels are breached.
How to Use
VLInterval: Users can input the interval for the vertical lines in minutes and select from 5, 15, 30, 60, 120, 240, 1440.
visibleTimeframe: Users can select the desired time frame where the vertical lines will be visible.
Color and Style: Users can freely modify the color and style of the lines.
Apply the indicator to the chart.
Select the desired interval for the vertical lines.
Adjust the visibility and style of the lines as needed.
By adhering to these steps, traders can effectively incorporate this tool into their analysis, maximizing the utility of interval-based evaluations and observations.
소개
간격 수직 선 그리기 도구는 트레이더가 차트에서 특정 간격을 시각화할 수 있도록 도와주는 지표입니다. 이 스크립트는 트레이더들이 다양한 시간 프레임에서 더 정확한 분석을 수행할 수 있게 해줍니다.
작동 원리
이 스크립트는 사용자가 정의한 간격에서 수직선을 그리는 방식으로 작동합니다. 사용자는 분 단위로 수직선 간격을 선택할 수 있고, 스크립트는 자동으로 차트의 각 간격에 수직선을 배치합니다. 예를 들어, 15분 간격이 선택되면, 차트에는 15분봉의 시작, 종료 시간마다 수직선이 나타납니다.
더불어, 이 스크립트는 각 수직선에서의 캔들의 시가를 나타내는 수평선을 그릴 수 있는 기능도 포함하고 있습니다. 이는 트레이더가 특정 시간 주변의 가격 행동을 관찰하고 정기적인 간격으로 시장 상황을 평가하는데 중요합니다.
이 스크립트는 다양한 시간 프레임에서 작동하며, 다양한 거래 스타일과 분석에 맞게 조정할 수 있습니다. 이는 효율적이고 사용자 친화적이며, 트레이더의 다양한 필요에 적응할 수 있습니다.
캔들의 시작가는 종종 지지 또는 저항의 역할을 하며, S/R이 깨질 때 큰 움직임이 일어날 가능성이 높습니다.
사용 방법
VLInterval: 사용자는 분 단위로 수직선 간격을 입력할 수 있으며, 5, 15, 30, 60, 120, 240, 1440 중에서 선택할 수 있습니다.
visibleTimeframe: 사용자는 수직선이 보이게 될 원하는 시간 프레임을 선택할 수 있습니다.
색상과 스타일: 사용자는 선의 색상과 스타일을 자유롭게 수정할 수 있습니다.
지표를 차트에 적용합니다.
수직선의 원하는 간격을 선택합니다.
선의 가시성과 스타일을 필요에 맞게 조정합니다.
The Interval Vertical Line Drawer is an indicator that assists traders in visualizing specific intervals on the chart. This script enables traders to conduct more accurate analyses across various time frames.
How It Works
This script operates by drawing vertical lines at intervals defined by the user. Users can select the interval for the vertical lines in minutes, and the script automatically places vertical lines at each interval on the chart. For instance, if a 15-minute interval is selected, vertical lines will appear at the start and end times of every 15-minute candle on the chart.
Additionally, this script includes a feature that allows drawing horizontal lines representing the open price of the candles at each vertical line. This is crucial for traders observing price action around specific times and evaluating market conditions at regular intervals.
This script is operative across diverse time frames and can be adjusted to fit various trading styles and analyses. It is efficient, user-friendly, and adaptable to the diverse needs of traders.
The open price of a candle often serves as a support or resistance, and there is a high possibility of significant movement occurring when these S/R levels are breached.
How to Use
VLInterval: Users can input the interval for the vertical lines in minutes and select from 5, 15, 30, 60, 120, 240, 1440.
visibleTimeframe: Users can select the desired time frame where the vertical lines will be visible.
Color and Style: Users can freely modify the color and style of the lines.
Apply the indicator to the chart.
Select the desired interval for the vertical lines.
Adjust the visibility and style of the lines as needed.
By adhering to these steps, traders can effectively incorporate this tool into their analysis, maximizing the utility of interval-based evaluations and observations.
소개
간격 수직 선 그리기 도구는 트레이더가 차트에서 특정 간격을 시각화할 수 있도록 도와주는 지표입니다. 이 스크립트는 트레이더들이 다양한 시간 프레임에서 더 정확한 분석을 수행할 수 있게 해줍니다.
작동 원리
이 스크립트는 사용자가 정의한 간격에서 수직선을 그리는 방식으로 작동합니다. 사용자는 분 단위로 수직선 간격을 선택할 수 있고, 스크립트는 자동으로 차트의 각 간격에 수직선을 배치합니다. 예를 들어, 15분 간격이 선택되면, 차트에는 15분봉의 시작, 종료 시간마다 수직선이 나타납니다.
더불어, 이 스크립트는 각 수직선에서의 캔들의 시가를 나타내는 수평선을 그릴 수 있는 기능도 포함하고 있습니다. 이는 트레이더가 특정 시간 주변의 가격 행동을 관찰하고 정기적인 간격으로 시장 상황을 평가하는데 중요합니다.
이 스크립트는 다양한 시간 프레임에서 작동하며, 다양한 거래 스타일과 분석에 맞게 조정할 수 있습니다. 이는 효율적이고 사용자 친화적이며, 트레이더의 다양한 필요에 적응할 수 있습니다.
캔들의 시작가는 종종 지지 또는 저항의 역할을 하며, S/R이 깨질 때 큰 움직임이 일어날 가능성이 높습니다.
사용 방법
VLInterval: 사용자는 분 단위로 수직선 간격을 입력할 수 있으며, 5, 15, 30, 60, 120, 240, 1440 중에서 선택할 수 있습니다.
visibleTimeframe: 사용자는 수직선이 보이게 될 원하는 시간 프레임을 선택할 수 있습니다.
색상과 스타일: 사용자는 선의 색상과 스타일을 자유롭게 수정할 수 있습니다.
지표를 차트에 적용합니다.
수직선의 원하는 간격을 선택합니다.
선의 가시성과 스타일을 필요에 맞게 조정합니다.
發行說明
optimize logic發行說明
add line display toggle option發行說明
fix line option bug發行說明
bug fix開源腳本
秉持TradingView一貫精神,這個腳本的創作者將其設為開源,以便交易者檢視並驗證其功能。向作者致敬!您可以免費使用此腳本,但請注意,重新發佈代碼需遵守我們的社群規範。
免責聲明
這些資訊和出版物並非旨在提供,也不構成TradingView提供或認可的任何形式的財務、投資、交易或其他類型的建議或推薦。請閱讀使用條款以了解更多資訊。
免責聲明
這些資訊和出版物並非旨在提供,也不構成TradingView提供或認可的任何形式的財務、投資、交易或其他類型的建議或推薦。請閱讀使用條款以了解更多資訊。