INVITE-ONLY SCRIPT
已更新 TrendCrypto
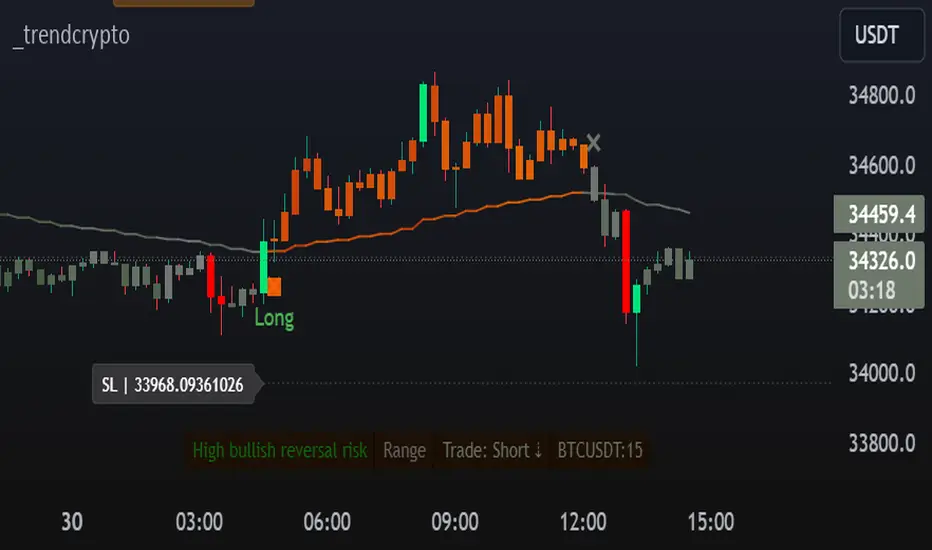
The _trendcrypto script is a trading strategy that uses a variety of indicators to identify potential trading opportunities, including the Parabolic SAR, ADX, and RSI.
The script first calculates the RMA, SMA, and trend direction. The RMA is a moving average that is weighted more heavily towards recent prices. The SMA is a simple moving average that gives equal weight to all prices in the period. The trend direction is calculated by comparing the current price to the price a certain number of periods ago.
The script then uses the RMA, SMA, and trend direction to identify potential trading opportunities. If the current price is above the RMA and the trend direction is up, the script will generate a buy signal. If the current price is below the RMA and the trend direction is down, the script will generate a sell signal.
The script also calculates the Parabolic SAR, which is a technical indicator that helps traders identify potential trend reversals. The Parabolic SAR is calculated using a formula that takes into account the high and low prices of a security over a specified period of time.
The script also calculates the ADX, which is a trend strength indicator. The ADX is calculated using a formula that takes into account the difference between the high and low prices of a security, as well as the difference between the closing price and the previous close.
The script also calculates the RSI, which is a momentum indicator that measures the magnitude of recent price changes to evaluate overbought or oversold conditions in the price of a stock or other asset. The RSI is calculated over a specified period of time, and the default value in the code is 14.
The script also allows users to specify a stop loss and take profit level for each trade. The default stop loss level is 4% and the default take profit level is 7%.
發行說明
Updated to new values發行說明
Update label transparency for light mode.僅限邀請腳本
僅作者批准的使用者才能訪問此腳本。您需要申請並獲得使用許可,通常需在付款後才能取得。更多詳情,請依照作者以下的指示操作,或直接聯絡dc_analytics。
TradingView不建議在未完全信任作者並了解其運作方式的情況下購買或使用腳本。您也可以在我們的社群腳本中找到免費的開源替代方案。
作者的說明
If you are interested, please let me know by sending me a message or visiting the website.
免責聲明
這些資訊和出版物並非旨在提供,也不構成TradingView提供或認可的任何形式的財務、投資、交易或其他類型的建議或推薦。請閱讀使用條款以了解更多資訊。
僅限邀請腳本
僅作者批准的使用者才能訪問此腳本。您需要申請並獲得使用許可,通常需在付款後才能取得。更多詳情,請依照作者以下的指示操作,或直接聯絡dc_analytics。
TradingView不建議在未完全信任作者並了解其運作方式的情況下購買或使用腳本。您也可以在我們的社群腳本中找到免費的開源替代方案。
作者的說明
If you are interested, please let me know by sending me a message or visiting the website.
免責聲明
這些資訊和出版物並非旨在提供,也不構成TradingView提供或認可的任何形式的財務、投資、交易或其他類型的建議或推薦。請閱讀使用條款以了解更多資訊。