PROTECTED SOURCE SCRIPT
已更新 Multi-Chart Relative Strength Oscillator[ChartGalaxy]
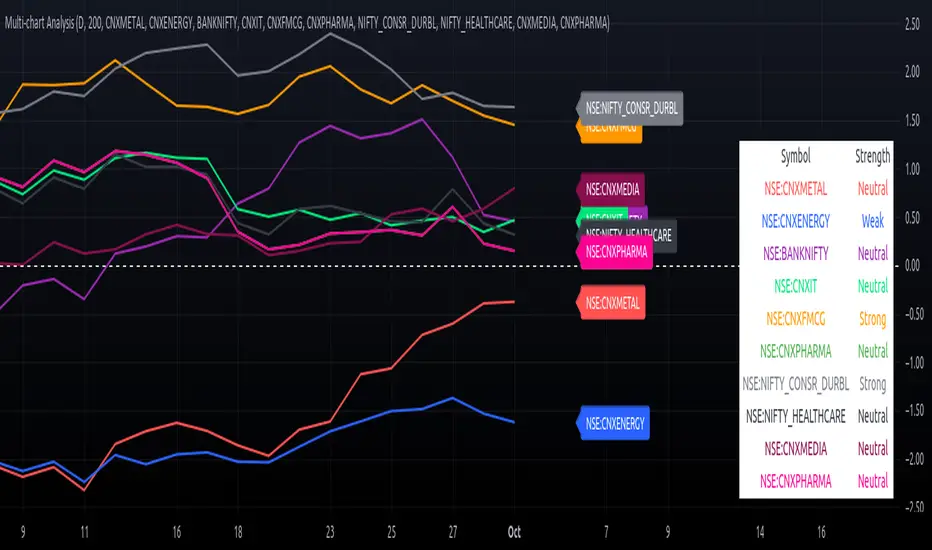
The Multi-Chart Relative Strength Oscillator is a powerful tool designed to compare the relative strength of up to 10 different market symbols (such as indices, stocks, or commodities). By normalizing each symbol's performance, this oscillator highlights which symbols are showing strength or weakness relative to each other over a selected time period.
Key Features:
How it Works:
Use Cases:
Customization Options:
This indicator is ideal for traders looking to conduct sector analysis, asset comparison, or relative strength studies across multiple symbols, providing them with an intuitive and easy-to-read visual tool.
Key Features:
- Multiple Symbols Comparison: Compare up to 10 different symbols simultaneously.
- Oscillator Calculation: Each symbol's price is normalized and converted into an oscillator, allowing for easy comparison of relative strength
- Custom Timeframes: Choose any resolution (e.g., daily, weekly) for analyzing the symbols.
- Dynamic Labeling: Each symbol is labeled on the chart for easy identification with color-coded labels that match the plotted lines.
- Strength Classification: Symbols are classified as "Strong", "Neutral", or "Weak" based on their performance relative to others.
- Optional Symbol Table: A table of the symbols and their strength is displayed on the chart, giving a quick overview of the current market conditions.
How it Works:
- Symbol Input: The user can input up to 10 market symbols (such as indices or stocks) they wish to compare.
- Oscillator Calculation: The indicator calculates the normalized value of each symbol over the selected time period, adjusting for standard deviation to create a relative strength oscillator.
- Visual Comparison: The symbols are plotted as oscillating lines on the chart, color-coded for easy differentiation. Additionally, labels appear on the right side of each plot to indicate the symbol.
- Strength Assessment: Each symbol is classified as Strong/Weal/Neutral
Use Cases:
- Sector Rotation Analysis: Compare different sectors (e.g., Energy, Technology, Healthcare) to see which sectors are gaining or losing relative strength.
- Asset Comparison: Analyze a group of stocks, commodities, or other assets to determine which are outperforming or underperforming.
- Market Overview: Get a broad overview of the market by comparing key indices and sectors to gauge the overall market sentiment.
Customization Options:
- Resolution Selection: Users can select their preferred timeframe for analysis (e.g., daily, weekly).
- Custom Symbol Selection: Input any symbol supported by TradingView to compare performance.
- Visual Clarity: Each symbol is plotted with distinct colors, and a label with the symbol’s name appears alongside the chart, making it easy to identify each line.
This indicator is ideal for traders looking to conduct sector analysis, asset comparison, or relative strength studies across multiple symbols, providing them with an intuitive and easy-to-read visual tool.
發行說明
overlay=false發行說明
[ADDED] show/hide specific label受保護腳本
此腳本以閉源形式發佈。 不過,您可以自由使用,沒有任何限制 — 點擊此處了解更多。
免責聲明
這些資訊和出版物並非旨在提供,也不構成TradingView提供或認可的任何形式的財務、投資、交易或其他類型的建議或推薦。請閱讀使用條款以了解更多資訊。
受保護腳本
此腳本以閉源形式發佈。 不過,您可以自由使用,沒有任何限制 — 點擊此處了解更多。
免責聲明
這些資訊和出版物並非旨在提供,也不構成TradingView提供或認可的任何形式的財務、投資、交易或其他類型的建議或推薦。請閱讀使用條款以了解更多資訊。