OPEN-SOURCE SCRIPT
Stochastic Moving Average Convergence Divergence (SMACD)
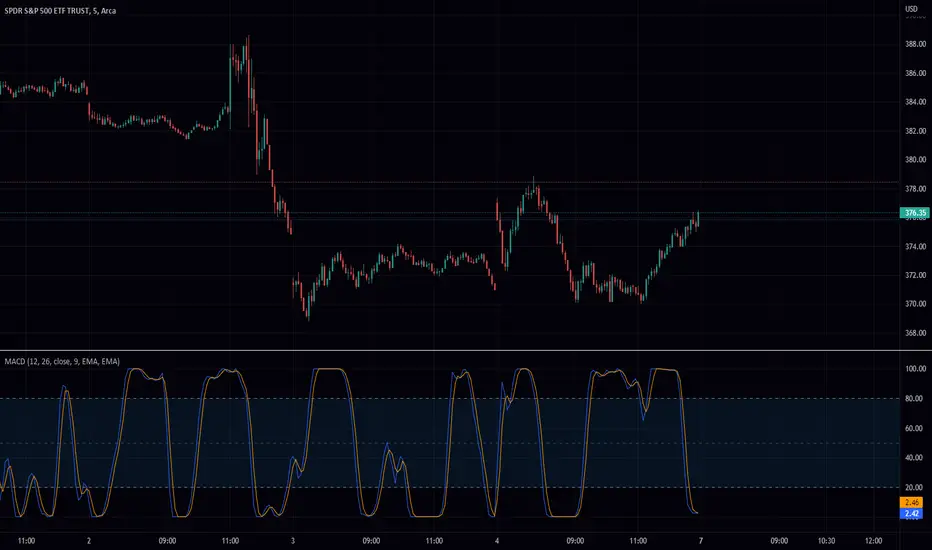
This is my attempt at making a Stochastic MACD indicator. To get this to work I have introduced a DC offset to the MACD histogram output. I figured that if theirs a Stochastic RSI their might as well be a Stochastic everything else! lmao enjoy. Honestly, from what I can tell it's even faster than Stochastic Smooth RSI.
The Stochastic Oscillator (STOCH) is a range bound momentum oscillator. The Stochastic indicator is designed to display the location of the close compared to the high/low range over a user defined number of periods. Typically, the Stochastic Oscillator is used for three things; Identifying overbought and oversold levels, spotting divergences and also identifying bull and bear set ups or signals
MACD is an extremely popular indicator used in technical analysis. MACD can be used to identify aspects of a security's overall trend. Most notably these aspects are momentum, as well as trend direction and duration. What makes MACD so informative is that it is actually the combination of two different types of indicators. First, MACD employs two Moving Averages of varying lengths (which are lagging indicators) to identify trend direction and duration. Then, MACD takes the difference in values between those two Moving Averages (MACD Line) and an EMA of those Moving Averages (Signal Line) and plots that difference between the two lines as a histogram which oscillates above and below a center Zero Line. The histogram is used as a good indication of a security's momentum
開源腳本
秉持TradingView一貫精神,這個腳本的創作者將其設為開源,以便交易者檢視並驗證其功能。向作者致敬!您可以免費使用此腳本,但請注意,重新發佈代碼需遵守我們的社群規範。
免責聲明
這些資訊和出版物並非旨在提供,也不構成TradingView提供或認可的任何形式的財務、投資、交易或其他類型的建議或推薦。請閱讀使用條款以了解更多資訊。
開源腳本
秉持TradingView一貫精神,這個腳本的創作者將其設為開源,以便交易者檢視並驗證其功能。向作者致敬!您可以免費使用此腳本,但請注意,重新發佈代碼需遵守我們的社群規範。
免責聲明
這些資訊和出版物並非旨在提供,也不構成TradingView提供或認可的任何形式的財務、投資、交易或其他類型的建議或推薦。請閱讀使用條款以了解更多資訊。