PROTECTED SOURCE SCRIPT
Mistab XAUUSD Strength Dashboard
Mistab XAUUSD Strength Dashboard
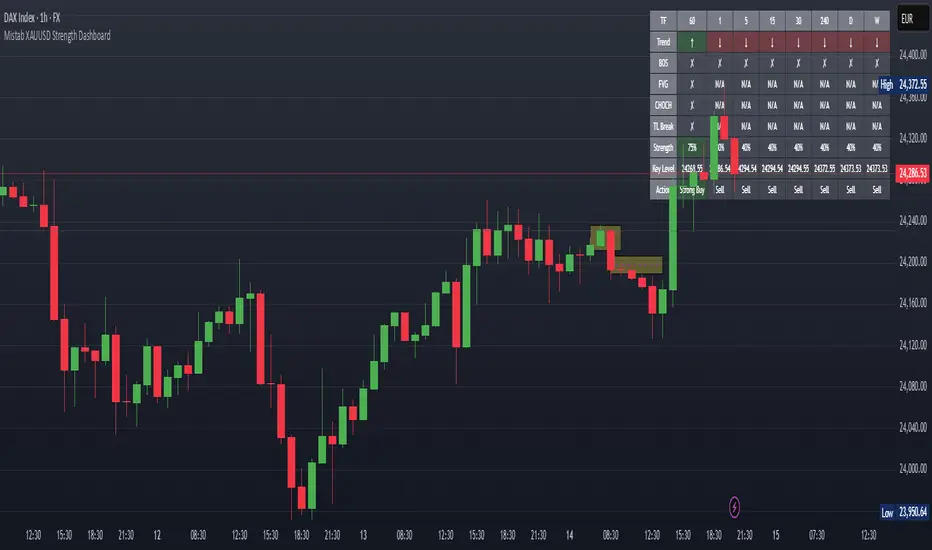
This advanced multi-timeframe dashboard is designed for XAUUSD traders who want a complete real-time market structure and momentum view in one place. It combines trend detection, Break of Structure (BOS), Fair Value Gaps (FVG), Change of Character (CHOCH), and trendline break alerts into a compact, on-chart table.
Key Features
📊 Multi-Timeframe Analysis – From 1-minute to Weekly, each timeframe is scanned for trend direction, BOS, FVG, CHOCH, and TL breaks.
📈 Strength Score Calculation – A 0–100 rating that blends multiple SMC (Smart Money Concepts) elements with moving averages to gauge overall market bias.
🟢 Buy/Sell Recommendations – Instant “Strong Buy”, “Buy”, “Neutral”, “Sell”, or “Strong Sell” signals based on combined technical conditions.
🎯 Key Level Tracking – Displays the most relevant high/low level for the current trend.
🔍 Visual Chart Markers – BOS, CHOCH, TL Breaks, and FVG zones are plotted directly on the chart for quick confirmation.
How to Use
Load the indicator on your XAUUSD chart.
The dashboard (top-right) shows each timeframe’s market bias and structure signals.
Look for confluence between multiple timeframes before taking trades.
Use BOS, CHOCH, and TL Break shapes on the chart to confirm entries.
FVG labels help identify potential price imbalance zones for targets or reversals.
Combine with your existing risk management and trade plan — this is an analysis tool, not a trade signal service.
Disclaimer
This script is for educational purposes only and does not constitute financial advice. Past performance does not guarantee future results. Always test strategies on demo accounts before applying to live markets. The author is not responsible for any financial losses incurred from using this tool. Trade responsibly.
受保護腳本
此腳本以閉源形式發佈。 不過,您可以自由且不受任何限制地使用它 — 在此處了解更多資訊。
免責聲明
這些資訊和出版物並不意味著也不構成TradingView提供或認可的金融、投資、交易或其他類型的意見或建議。請在使用條款閱讀更多資訊。
受保護腳本
此腳本以閉源形式發佈。 不過,您可以自由且不受任何限制地使用它 — 在此處了解更多資訊。
免責聲明
這些資訊和出版物並不意味著也不構成TradingView提供或認可的金融、投資、交易或其他類型的意見或建議。請在使用條款閱讀更多資訊。