OPEN-SOURCE SCRIPT
Wick/Tail Candle Measurements
This indicator runs on trading view. It was programmed with pine script v5.
Once the indicator is running you can scroll your chart to any year or date on the chart, then for the input select the date your interested in knowing the length of the tails and wicks from a bar and their lengths are measured in points.
To move the measurement, you can select the vertical bar built into the indicator AFTER clicking the green label and moving it around using the vertical bar *only*. You must click the vertical bar in the middle of the label to move the indicator calculation to another bar. You can also just select the date using the input as mentioned. This indicator calculates just one bar at a time.
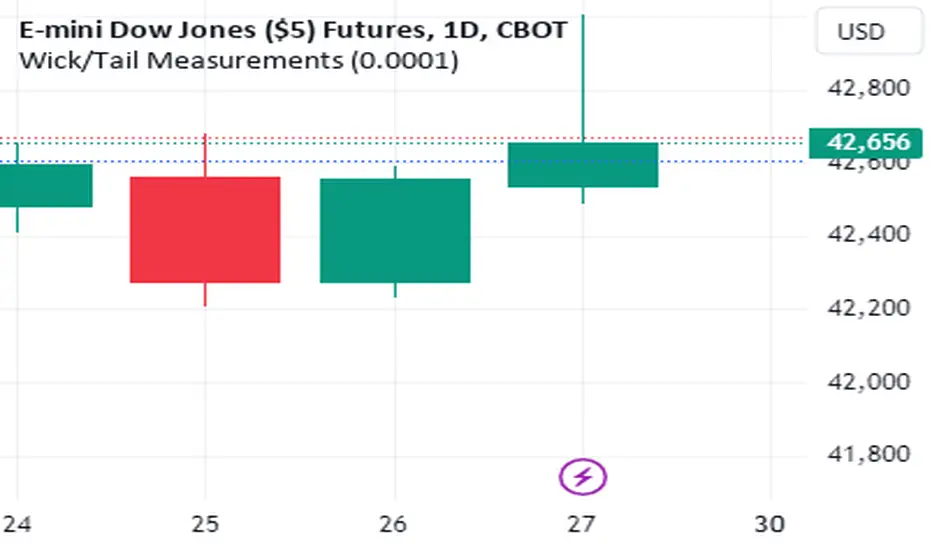
measurements are from bar OPEN to bar HIGH for measured WICKS regardless of the bar being long or short and from bar OPEN to bar LOW for measured TAILS also regardless of the bar being long or short.
This indicator calculates tails and wicks including the bar body in the calculations. Basically showing you how much the market moved in a certain direction for the entire duration of that Doji candle.
Its designed to measure completed bars on the daily futures charts. (Dow Jones, ES&P500, Nasdaq, Russell 2000, etc) Although it may work well on other markets. The indicator could easily be tweaked in order to work well with other markets. It is not designed for forex markets currently.
Once the indicator is running you can scroll your chart to any year or date on the chart, then for the input select the date your interested in knowing the length of the tails and wicks from a bar and their lengths are measured in points.
To move the measurement, you can select the vertical bar built into the indicator AFTER clicking the green label and moving it around using the vertical bar *only*. You must click the vertical bar in the middle of the label to move the indicator calculation to another bar. You can also just select the date using the input as mentioned. This indicator calculates just one bar at a time.
measurements are from bar OPEN to bar HIGH for measured WICKS regardless of the bar being long or short and from bar OPEN to bar LOW for measured TAILS also regardless of the bar being long or short.
This indicator calculates tails and wicks including the bar body in the calculations. Basically showing you how much the market moved in a certain direction for the entire duration of that Doji candle.
Its designed to measure completed bars on the daily futures charts. (Dow Jones, ES&P500, Nasdaq, Russell 2000, etc) Although it may work well on other markets. The indicator could easily be tweaked in order to work well with other markets. It is not designed for forex markets currently.
開源腳本
秉持TradingView一貫精神,這個腳本的創作者將其設為開源,以便交易者檢視並驗證其功能。向作者致敬!您可以免費使用此腳本,但請注意,重新發佈代碼需遵守我們的社群規範。
免責聲明
這些資訊和出版物並非旨在提供,也不構成TradingView提供或認可的任何形式的財務、投資、交易或其他類型的建議或推薦。請閱讀使用條款以了解更多資訊。
免責聲明
這些資訊和出版物並非旨在提供,也不構成TradingView提供或認可的任何形式的財務、投資、交易或其他類型的建議或推薦。請閱讀使用條款以了解更多資訊。