PROTECTED SOURCE SCRIPT
已更新 Southnjes - RSI Zones.

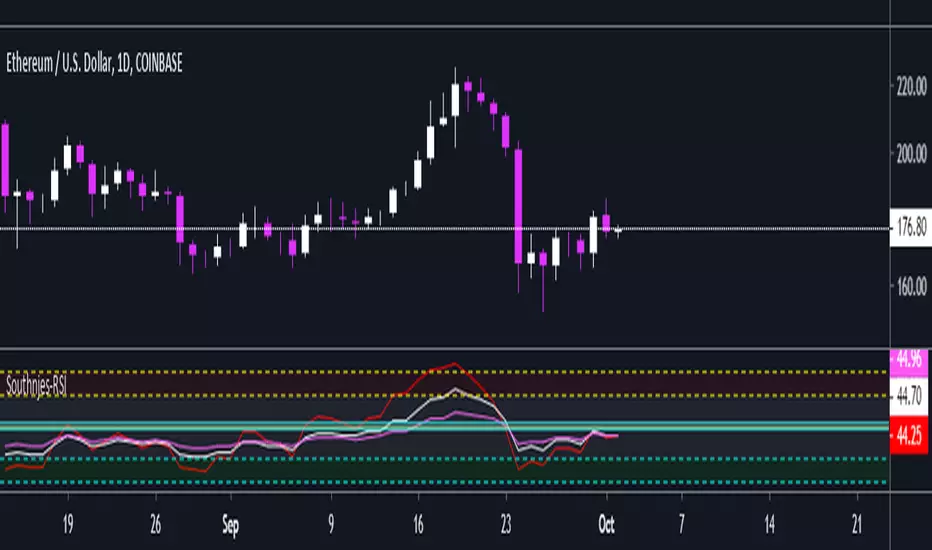
Here is a simple RSI indicator that has changeable values. It has centerline at 50% along with areas of interest for conservative overbought/oversold along with aggressive overbought/oversold areas. The 70/30 and 85/15 values are built in but you can change them to whatever you want. The upper and lower interest areas are banded with color for ease of viewing.
After watching ChingasX RSI video from Tradingroomap where Chingas added custom lines. I thought I'd give back a little and upload my script that I have been using.
Hope someone finds it useful. :)
After watching ChingasX RSI video from Tradingroomap where Chingas added custom lines. I thought I'd give back a little and upload my script that I have been using.
Hope someone finds it useful. :)
發行說明
Added the second value RSI level (per Chingas X request). He gives so much back to the community. :)發行說明
Added a third RSI input level for a longer, smoother period. You now have:7: Shorter-term trading (Noiser/more oscillation).
14: Standard.
25: Longer-term trading (Smoother, less oscillation).
Don't forget the importance of the centerline either.
Per dailyFX:
"Technical forex traders use the centerline to show shifts in the trend. If RSI is above 50, momentum is considered up and traders can look for opportunities to buy the market. A drop below 50 would indicate the development of a new bearish market trend".
:)
發行說明
Added a third RSI input level for a longer, smoother period. You now have:7: Shorter-term trading (Noiser/more oscillation).
14: Standard.
25: Longer-term trading (Smoother, less oscillation).
Don't forget the importance of the centerline either.
Per dailyFX:
"Technical forex traders use the centerline to show shifts in the trend. If RSI is above 50, momentum is considered up and traders can look for opportunities to buy the market. A drop below 50 would indicate the development of a new bearish market trend".
:)
受保護腳本
此腳本以閉源形式發佈。 不過,您可以自由且不受任何限制地使用它 — 在此處了解更多資訊。
免責聲明
這些資訊和出版物並不意味著也不構成TradingView提供或認可的金融、投資、交易或其他類型的意見或建議。請在使用條款閱讀更多資訊。
受保護腳本
此腳本以閉源形式發佈。 不過,您可以自由且不受任何限制地使用它 — 在此處了解更多資訊。
免責聲明
這些資訊和出版物並不意味著也不構成TradingView提供或認可的金融、投資、交易或其他類型的意見或建議。請在使用條款閱讀更多資訊。