OPEN-SOURCE SCRIPT
HODL LINE [AstrideUnicorn]
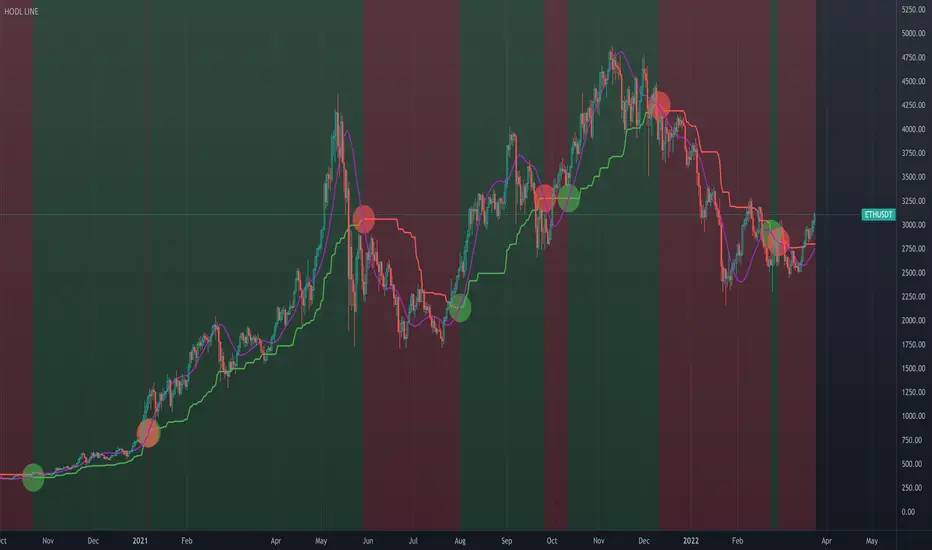
This indicator determines periods of bull market when a buy-and-hold investor can hold the asset, and bear market periods when they should avoid holding it. Though it was designed primarily with cryptocurrencies in mind, it can be successfully used for any market.
Technically, the indicator is an asymmetric trend filter aimed to account for the fact that market sell-offs tend to be sharper than up-trends. The algorithm has two regimes – with and without price smoothing.
HOW TO USE
The step-like line is the main trend filter. It is colored green in an uptrend and red in a downtrend. When the smoothing is on, in addition to the trend filter, the indicator plots a purple line. It is a Hull Moving Average (HMA) of the price. In this case, the indicator uses this line instead of the price to find crossings with the trend filter.
When the price or the smoothed line crosses the trend filter above, it is an uptrend signal. The indicator marks such crossings with green circles. It also colors the chart background green in an uptrend. The price or the purple line crossing the trend filter below means a downtrend signal. Downtrend signals show as red circles. The chart background in a downtrend turns red.
SETTINGS
Sensitivity – a dropdown list that allows the user to choose an averaging period of the indicator. Users can select a value for sensitivity from a predetermined set that better suits their investment horizon.
Use Smoothing – turns on and off smoothing of the price with HMA. With the smoothing turned on, the indicator responds slower to price changes, but at the same time produces less amount of false signals.
開源腳本
本著TradingView的真正精神,此腳本的創建者將其開源,以便交易者可以查看和驗證其功能。向作者致敬!雖然您可以免費使用它,但請記住,重新發佈程式碼必須遵守我們的網站規則。
Our premium trading indicators: unicorn.trading
Join our Discord community: dsc.gg/unicom
Join our Discord community: dsc.gg/unicom
免責聲明
這些資訊和出版物並不意味著也不構成TradingView提供或認可的金融、投資、交易或其他類型的意見或建議。請在使用條款閱讀更多資訊。
開源腳本
本著TradingView的真正精神,此腳本的創建者將其開源,以便交易者可以查看和驗證其功能。向作者致敬!雖然您可以免費使用它,但請記住,重新發佈程式碼必須遵守我們的網站規則。
Our premium trading indicators: unicorn.trading
Join our Discord community: dsc.gg/unicom
Join our Discord community: dsc.gg/unicom
免責聲明
這些資訊和出版物並不意味著也不構成TradingView提供或認可的金融、投資、交易或其他類型的意見或建議。請在使用條款閱讀更多資訊。