INVITE-ONLY SCRIPT
SagaView
SagaView is an author's analytical tool where the visual part consists of zones and levels (these parts are described in more detail below).
This indicator allows you to determine whether the market is oversold or overbought, and use the levels of the indicator to determine the probability of price reversal.
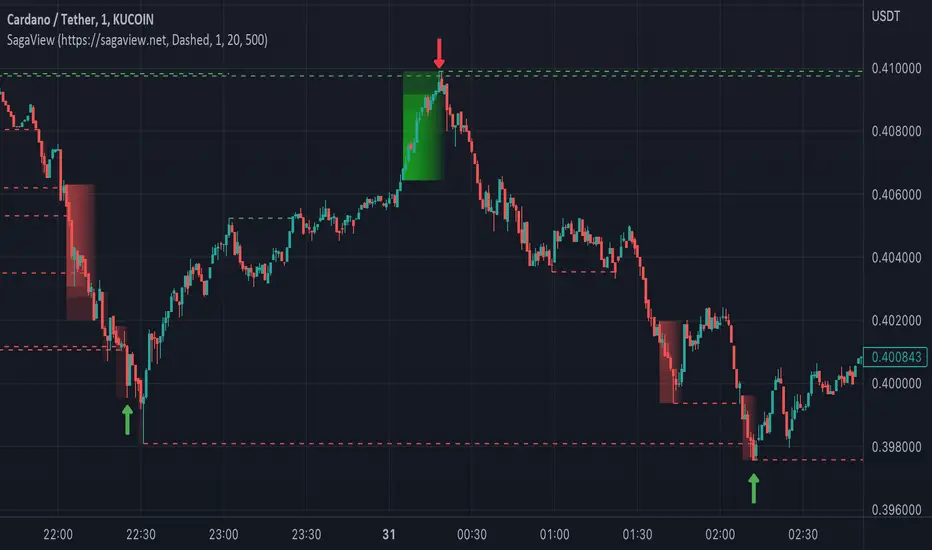
SagaView Zones
SagaView zones show areas of the market that are overbought/oversold. These zones are determined on the basis of the closing prices of the previous bars. SagaView zones may differ in size (number of candles included in the shaded area). The larger the size of the zone, the higher the probability of an imminent price reversal. Also, in the case of a smaller zone size, it can indicate the emergence of a strong movement. SagaView levels are used to determine the potential of movement and probability of reversal.
SagaView levels
SagaView levels are built from local extremums. These levels are potential levels of resistance or support. A large number of crossings of the level by the price usually reduces its importance. SagaView levels display a line on the chart only until it is crossed by price to filter a weak levels. Also, a level can lose its strength over time. But in SagaView you can filter out levels that are too old (even if they have not been crossed by price).
Using SagaView
Thus, the SagaView zones make it possible to determine the trending areas of the market (a number of bars in the shaded area), and the SagaView levels make it possible to assess the probability of a price reversal in these areas.
Disclamer: remember that financial markets carry risks and no trading tool will guarantee you earnings.
Only your cold mind and knowledge.
This indicator allows you to determine whether the market is oversold or overbought, and use the levels of the indicator to determine the probability of price reversal.
SagaView Zones
SagaView zones show areas of the market that are overbought/oversold. These zones are determined on the basis of the closing prices of the previous bars. SagaView zones may differ in size (number of candles included in the shaded area). The larger the size of the zone, the higher the probability of an imminent price reversal. Also, in the case of a smaller zone size, it can indicate the emergence of a strong movement. SagaView levels are used to determine the potential of movement and probability of reversal.
SagaView levels
SagaView levels are built from local extremums. These levels are potential levels of resistance or support. A large number of crossings of the level by the price usually reduces its importance. SagaView levels display a line on the chart only until it is crossed by price to filter a weak levels. Also, a level can lose its strength over time. But in SagaView you can filter out levels that are too old (even if they have not been crossed by price).
Using SagaView
Thus, the SagaView zones make it possible to determine the trending areas of the market (a number of bars in the shaded area), and the SagaView levels make it possible to assess the probability of a price reversal in these areas.
Disclamer: remember that financial markets carry risks and no trading tool will guarantee you earnings.
Only your cold mind and knowledge.
僅限邀請腳本
僅作者批准的使用者才能訪問此腳本。您需要申請並獲得使用許可,通常需在付款後才能取得。更多詳情,請依照作者以下的指示操作,或直接聯絡NorveComp。
TradingView不建議在未完全信任作者並了解其運作方式的情況下購買或使用腳本。您也可以在我們的社群腳本中找到免費的開源替代方案。
作者的說明
Get access here: https://sagaview.net
免責聲明
這些資訊和出版物並非旨在提供,也不構成TradingView提供或認可的任何形式的財務、投資、交易或其他類型的建議或推薦。請閱讀使用條款以了解更多資訊。
僅限邀請腳本
僅作者批准的使用者才能訪問此腳本。您需要申請並獲得使用許可,通常需在付款後才能取得。更多詳情,請依照作者以下的指示操作,或直接聯絡NorveComp。
TradingView不建議在未完全信任作者並了解其運作方式的情況下購買或使用腳本。您也可以在我們的社群腳本中找到免費的開源替代方案。
作者的說明
Get access here: https://sagaview.net
免責聲明
這些資訊和出版物並非旨在提供,也不構成TradingView提供或認可的任何形式的財務、投資、交易或其他類型的建議或推薦。請閱讀使用條款以了解更多資訊。